Economic insight provided by Alberta Central Chief Economist Charles St-Arnaud.
Main takeaways
- Canadian households have faced a sharp rise in the cost-of-living in recent years, as inflation reached levels not seen since the 1980s.
- Moreover, with wage growth being weaker than inflation, households have seen a reduction in their purchasing power.
- Looking at the provincial data, we find that Albertans have seen the most significant underperformance in their purchasing power since 2019 of all Canadian provinces.
- As such, we find that real wage and income in Alberta have declined by 3.6% on average since 2019, while it has increased by 3.3% nationwide over the same period; cumulatively, this is an underperformance of more than 6%.
- This divergence cannot be attributable to inflation, as inflation in Alberta has been mostly in line with the rest of the country.
- Instead, significantly lower wages and income growth in Alberta are responsible for the lower purchasing-power. This weakness is broad-based and cannot be attributed to a specific industry or labour cohort.
- The source of the weaker wages and income growth will be explored in an upcoming report. However, preliminary findings suggest that the situation is the result of: 1) a strong migration to Alberta keeping the supply of workers higher than in other parts of the country, and 2) continued adjustment following the 2010s energy boom-bust cycle.
- While Alberta’s wages and income underperformance in recent years is notable, it needs to be put into a context where both measures were higher than their national counterparts.
- However, the underperformance means that the “Alberta Advantage” is melting away rapidly, to a point where it has disappeared based on some measures.
The sharp rise in the cost of living since mid-2021, with inflation reaching levels not seen since the early 1980s, has been a significant preoccupation for many Canadian households. The fact that wage growth has underperformed inflation nationally over the past year adds to those concerns, as it reduces households’ purchasing power. And it is not just inflation that has affected households’ financial health; the sharp rise in interest rates is also impacting households financially. The combination of higher inflation and interest rates is what we have dubbed as, “The Great Consumer Squeeze” (see The Great Consumer Squeeze).
However, looking at the provincial data, there are some significant divergences in the change in households’ purchasing power over the past few years. More specifically, we note that Albertans have seen a significant underperformance in their purchasing power relative to other provinces.
Alberta has a lower purchasing power compared to 2019
To measure households’ purchasing power, we look at various measures of wages and income adjusted for inflation, namely average wage for permanent workers, median wages for permanent workers, average weekly earnings, compensation of employees per household, and disposable income per household. To remove the distortions caused by the pandemic, we compare these measures of purchasing power to their 2019 levels.
What we find is that Alberta underperforms significantly compared to the rest of the country across all metrics considered. (All the measures by province can be found in Appendix) As such, real wages in the province, both median and average, have declined by 5.8% and 5.2%, respectively. This means that purchasing power is now lower than in 2019. In comparison, the same measures for the country are 1.7% and 1.2% higher, respectively.
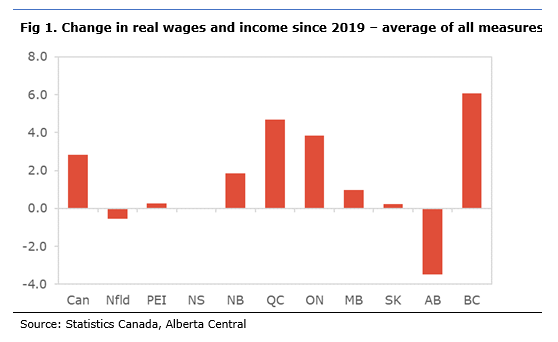
Similarly, real average weekly earnings declined by 3.1% over the period in Alberta, while it remained almost unchanged for Canada as a whole. In the case of the compensation of employees, it decreased by 3.6% compared to a rise of 3.4% in the rest of the country. Real disposable income edged higher by 1.3% in Alberta over the period but increased 7.4% in the rest of Canada.
On average, Alberta’s purchasing power has declined by 3.6%, while it increased by 3.3% in the rest of the country. This is an underperformance of 6.9% relative to the rest of Canada, which is quite considerable given the relatively brief period of about three years.
What is causing this significant divergence? Is it caused by higher inflation in Alberta over the period relative to Canada, or is it a dramatic wage underperformance in the province?
Inflation
The inflation rate in Canada has been on a rollercoaster since 2019. It stayed around the Bank of Canada’s target of 2% for most the year, before falling to zero when energy prices dropped substantially during the early stage of the pandemic in 2020. As the economy reopened in early 2021, commodity prices recovered and supply chain disruptions led to product shortages; as a result, inflation started to trend back upwards and ended the year at around 5%. It jumped higher in early 2022, reaching about 8% by mid-2022, when energy prices spiked due to the Russian invasion of Ukraine. As energy prices and other commodity prices started to ease in the second half of the year, inflation started its slow deceleration towards its current elevated level of about 5%.
Looking at the provincial details of inflation, it is interesting to note that there is no significant divergence between provinces. As such, compared to end of 2019, CPI has increased by a cumulative 13%. It rose the least in Alberta (11.4%) and the most in PEI (16.6%).

The fact that Alberta saw the lowest cumulative price increase over the period is of note. It means that inflation is not the reason for the province’s comparative purchasing power underperformance. In fact, smaller price increases should have led to an outperformance if wages and income grew at the same pace as the rest of the country.
Wages and income
Given that the rise in price levels is very similar across provinces, most of the evolution of the purchasing power during the period can be attributed to divergence in the evolution of wages and income.
We find that, since 2019, nominal wages and income in Canada have increased by 16.5%, with the rise ranging between 14% for average weekly earnings and 21% for disposable income. Comparatively, nominal wages and income in Alberta only increased by 8.6% on average across all measures. This is an underperformance of almost 8% since 2019.
At the other end of the spectrum, BC, Quebec and Ontario have seen a broad outperformance in terms of wages and income over the period. This situation explains the gains in purchasing power for those provinces over the period.
The reason for the underperformance in Alberta will be essential to analyze and will be the topic of an upcoming report. However, it is important to note that this underperformance in wages and income is broad-based, and the result is not due to specific industries or cohorts of worker.
Although it would be easy to blame the wage underperformance since 2019 on the sharp drop in oil prices in 2020, our initial analysis suggests that other factors are behind the underperformance in Alberta. First, the strong migration to Alberta, both interprovincial and international, is keeping the supply of workers higher than in other parts of the country, thereby reducing wage pressures. This can be seen in the comparatively lower job vacancy rate in the province. A second reason for this underperformance is the continued adjustment following the 2010s energy boom-bust cycle; after years of excess demand for labour in the 2000s and the first part of the 2010s, which drove wages well above the national average, we are seeing a return to normal with a convergence in wages toward the levels seen in the rest of the country.
The “Alberta Advantage” is melting away
Alberta’s wages and income underperformance in recent years is notable. However, it is important to put the situation into perspective and not focus solely on the change in purchasing power but also on its level.
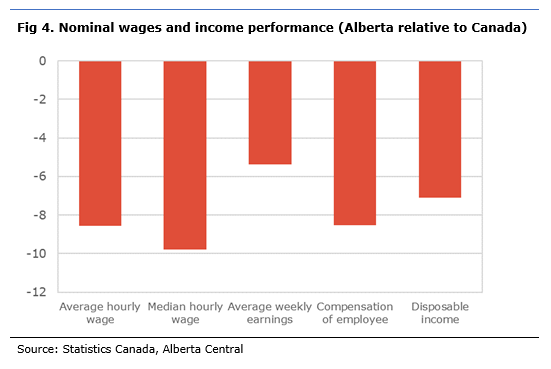
Back in 2019, Alberta had a real wage and income advantage, with hourly wages and weekly earnings being 6% to 9% above the rest of the country, while compensation of employees and disposable income were, respectively, 23% and 20% higher than in the rest of the country.

Due to the underperformance in wages and income in recent years, hourly wages in Alberta are now on par with the rest of the country, while weekly earnings are only 3% higher. However, when considering broader measures of income, compensation of employees and disposable income are still about 14% above the rest of the country. This means that the typical Albertan still earns more, on average, than households in the rest of the country. However, what has been often referred to as “the Alberta Advantage” is melting away and has almost disappeared, based on some metrics.
As mentioned earlier, it is essential to further explore the driving factors behind this rapid convergence in wages and income. This will be the subject of an upcoming report.
Conclusion
Compared to the rest of the country, households in Alberta are feeling more acutely the impact of high inflation. However, it is not because inflation has been stronger in the province. Instead, it is the result of a significant underperformance in wages and income in Alberta relative to the rest of the country. This weakness is broad-based and cannot be attributed to the performance of a specific industry or employment cohort. Some preliminary research suggests that structural factors linked to the boom-bust cycle of the Alberta economy and the continued strong increase in labour supply are responsible for the reduction in Alberta’s purchasing power. Nevertheless, it is worth mentioning that, despite the underperformance in wages and income in the province, they remain at or above the national average, but converging rapidly.
Independent Opinion
The views and opinions expressed in this publication are solely and independently those of the author and do not necessarily reflect the views and opinions of any organization or person in any way affiliated with the author including, without limitation, any current or past employers of the author. While reasonable effort was taken to ensure the information and analysis in this publication is accurate, it has been prepared solely for general informational purposes. There are no warranties or representations being provided with respect to the accuracy and completeness of the content in this publication. Nothing in this publication should be construed as providing professional advice on the matters discussed. The author does not assume any liability arising from any form of reliance on this publication.