Economic commentary provided by Alberta Central Chief Economist Charles St-Arnaud.
Bottom line
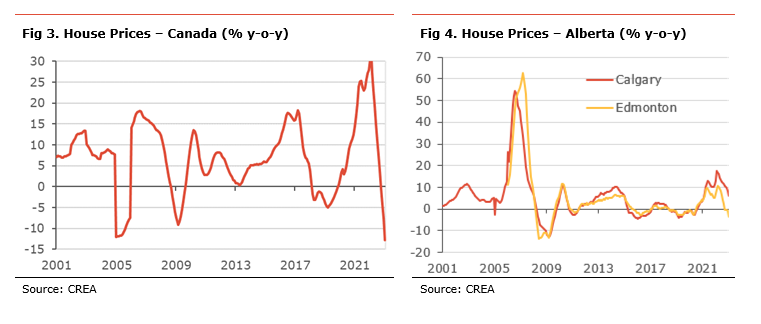
National house prices declined for a tenth consecutive month. Since the start of the correction, prices nationally have fallen by 15.1%. However, the correction has been more significant in some markets, especially those with the most significant post-pandemic gains. Rising interest rates since the start of 2022 have had a cooling impact on the housing market.
In Alberta, housing market activity eased but remained robust by historical standards. We note a divergence between the metropolitan areas, with Calgary, where prices have yet to peak, the strongest city in Canada, while the price correction continued in Edmonton. With less froth accumulated during the pandemic, Alberta’s market is likely less prone to a sharp correction than other regions, notably Ontario. In addition, strong migration to Alberta will also support activity and prices compared to elsewhere in the country.
Low interest rates have been one of the main drivers of the housing market, supporting affordability. The moderation in activity since the Bank of Canada started to raise rates in March points to further weakness this year, especially with the policy rate having increased 425bp in 2022. As we have shown recently (see), further significant declines in house prices, especially in Toronto, Vancouver, Montreal and Ottawa, will be required to restore affordability. However, the continued lack of supply in many regions and increased immigration could provide some support.
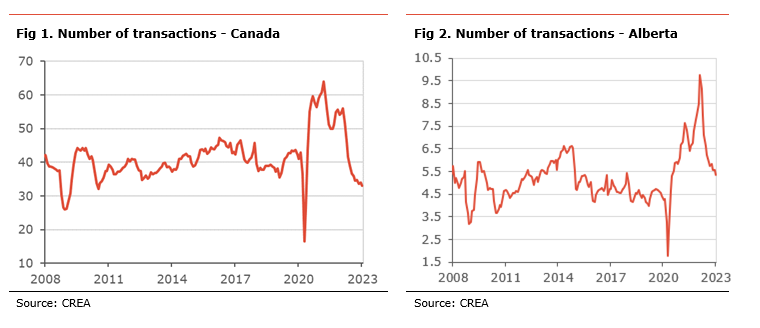
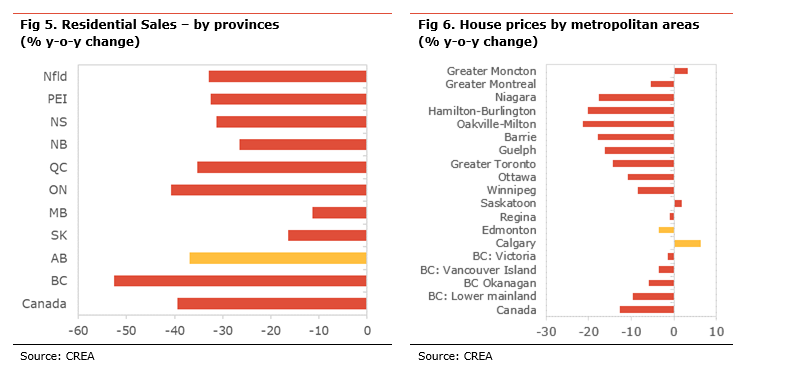
Activity in the Canadian housing market decreased by 3.0% m-o-m seasonally-adjusted in Janaury. The number of transactions, at 33.0k, is almost 20% lower than on average in 2019 and 39% lower than for the same month last year. It is important to note that all the year-on-year comparisons are distorted by the sharp boom in activity a year ago and, as a result, we will focus on the changes compared to 2019. Activity was generally lower at provincial level, except for an increase in PEI and Ontario and unchanged activity in Manitoba. The biggest declines in transactions were in Nova Scotia, BC and Quebec. In Alberta, the number of transactions declined (-4.1% m-o-m) in January, but activity was about 25% higher than in 2019.
There continue to be some divergences between provincial markets. Compared to the average level of 2019, the number of transactions is well above its pre-pandemic level in Alberta (+25%), Saskatchewan (+18%), and Newfoundland (+54%). On the flip side, activity is well below in Ontario (-27%), Quebec (-26%), and BC (-23%).
New listings rose by 3.3% m-o-m seasonally-adjusted in January. The increase was mainly the result of a correction in listings in BC, after a weak December. Most provinces saw lower new listings led by Newfoundland (-5.8% m-o-m), Nova Scotia (-5.4% m-o-m), Alberta (-4.6% m-o-m) and Saskatchewan (-3.5% m-o-m).
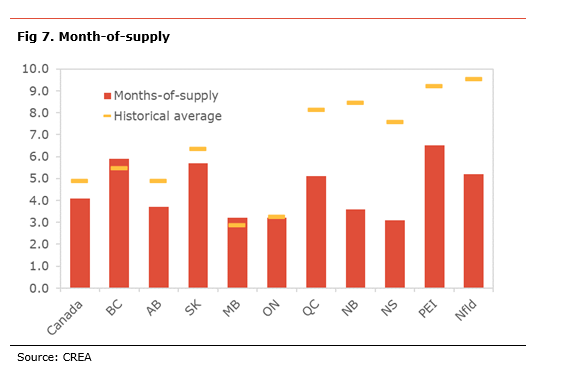
With sales activity weaker than new listings in most regions, the month-of-supply measure[1] eased to 4.3 nationally, still below its pre-pandemic level, but 2.6 months higher than its recent low. Based on this measure, most provinces have seen an increase in inventories in January but are still below their 2019 levels, with the exception of BC, Ontario and PEI. Compared to the lowest level of inventory over the past two years, the month-of-supply has increased the most in BC (+4.4 months), PEI (+4.2 months), Quebec (+3.4 months), and Ontario (+2.3 months). It has increased the least in Newfoundland (+0.4 months), New Brunswick (+1.7 months), Saskatchewan (+1.7 months), Manitoba (1.7 months) and Alberta (+1.7 months). With a month-of-supply at 3.8, Alberta’s housing market remains much tighter than before the pandemic (7.0 months on average in 2019).
With sales moderating and inventories increasing, the MLS House Price Index declined by 1.9% m-o-m, its tenth consecutive month of decline. Compared to last year, house prices eased nationally by 12.8% y-o-y. Most areas saw a decrease in prices on the month. The biggest monthly declines were in Oakville-Milton (-3.9% m-o-m), Ottawa (-2.8% m-o-m), Barrie (-2.5% m-o-m), Niagara (-2.3% m-o-m), and Greater Toronto (-2.2% m-o-m). Prices increased in Saskatoon (+1.5% m-o-m), Calgary (+0.4% m-o-m) and Regina (+0.1% m-o-m).
On a y-o-y basis, the most significant declines were in Oakville-Milton (-21.4% y-o-y), Hamilton-Burlington (-20.3% y-o-y), Barrie (-18.0% y-o-y), and Niagara (-17.7% y-o-y). Compared to last year, prices rose only in Calgary (+6.3% y-o-y), Moncton (+3.3% y-o-y), and Saskatoon (+1.9% m-o-m).
Compared to their recent peaks, prices have declined by 15.1% nationally and the most in Hamilton-Burlington (-23%), Oakville-Milton (-23%), Niagara (-20%), Barrie (-20%), and Guelph (-19%). Prices have corrected the least in Saskatoon (-0.6%), Regina (-1.2%), Moncton (-5.6%), and Montreal (-6.7%), while Calgary is the only city where prices haven’t peaked yet.
In Alberta, benchmark prices rose 0.4% m-o-m and 6.3% y-o-y in Calgary, and decreased 1.5% m-o-m and -3.5% y-o-y in Edmonton. There continues to be a divergence between the performance in Edmonton and Calgary, likely resulting from higher inventories in Edmonton.
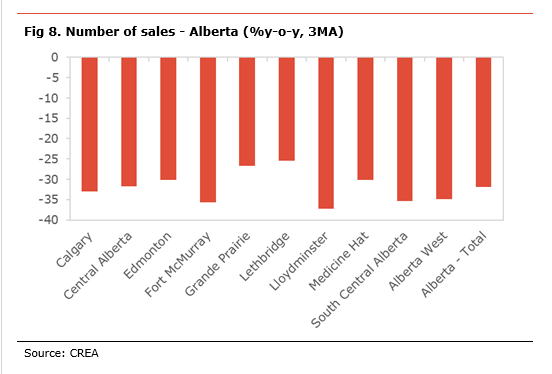
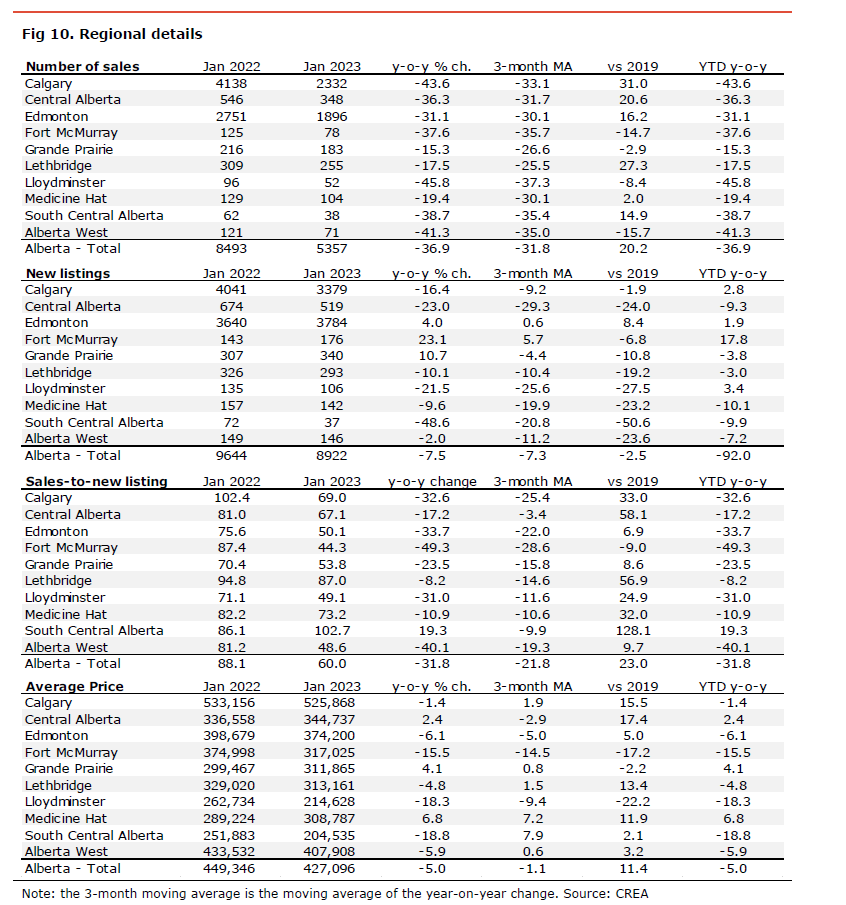
In Alberta, the housing market remains robust, with the level of transactions still above their pre-pandemic level. However, the number of transactions has eased in all regions compared to last year’s same month. (see table below for details). Compared to the average level of transactions in 2019, activity in the province increased by 20%, led by Calgary (31%), Lethbridge (+27%), Central Alberta (+21%) and Edmonton (+16%). Activity is the weakest in Alberta West (-16%), Fort McMurray (-15%), Lloydminster (-8%) and Grande Prairie (-3%).
New listings decline on the month at the provincial level. Compared to the average level of new listings in 2019, new supply in the province decreased by 2.5% and was lower in most regions, except for Edmonton (+8%). New listings declined the most compared to 2019 in South Central Alberta (-51%), Lloydminster (-27%), Central Alberta (-24%), Alberta West (-24%), and Medicine Hat (-23%).
With sales weaker than new listings, many regions have seen an easing of their housing markets. The primary seller’s markets are South Central Alberta, Lethbridge, Central Alberta, and Calgary. The main buyer’s markets are Fort McMurray, Edmonton, Lloydminster, and Grande Prairie.
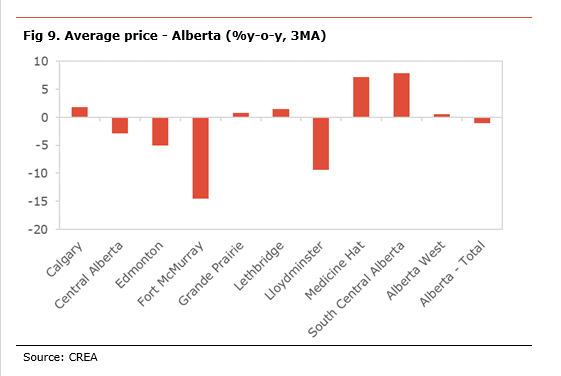
Average house prices declined by 1.1% on a 3-month moving average of year-on-year in the province, but was mixed at a regional level. Prices increase the most in South Central Alberta (7.9%), Medicine Hat (+7.2%), Calgary (+1.9%) and Lethbridge (+1.5%). The biggest house prices declines were in Fort McMurray (-14.5%), Lloydminster (-9.4%), Edmonton (-5.0%), and Central Alberta (-2.9%).
[1] The month of supply measures how many months is would take at current sales volume and without an increase in listings to bring inventories to 0.
Independent Opinion
The views and opinions expressed in this publication are solely and independently those of the author and do not necessarily reflect the views and opinions of any organization or person in any way affiliated with the author including, without limitation, any current or past employers of the author. While reasonable effort was taken to ensure the information and analysis in this publication is accurate, it has been prepared solely for general informational purposes. There are no warranties or representations being provided with respect to the accuracy and completeness of the content in this publication. Nothing in this publication should be construed as providing professional advice on the matters discussed. The author does not assume any liability arising from any form of reliance on this publication.