Economic insight provided by Alberta Central Chief Economist Charles St-Arnaud.
Main takeaways
- Low interest rates have been a significant source of support for the housing market in Canada in recent years, helping to maintain affordability.
- With the Bank of Canada increasing its policy rates by 400bp this year, from 0.25% to 4.25%, there are concerns about its impact on the housing market.
- Already, house prices in Canada have declined by about 10% since the BoC started to increase interest rates, with bigger declines in areas where house prices increased the most in recent years.
- We have updated our valuation metrics to take stock of the move in both prices and interest rates. We find that Toronto, Montreal, Ottawa and Vancouver moved further into overvalued territory, as price declines are insufficient to offset the impact of higher interest rates.
- In the case of Calgary and Edmonton, valuation metrics are only marginally above their historical average, signaling little to no concerns.
- Looking more closely at affordability, we find that houses in Toronto have never been this unaffordable in more than 40 years. In Vancouver, Montreal and Ottawa, affordability is at its lowest since the early 1980s, when interest rates were around 20%. In Calgary and Edmonton, affordability is in line with the historical average.
- Conducting some simulations to calculate how much house prices need to decline to restore affordability, we find that house prices would need to drop by another 35-40% in Toronto, Vancouver, Ottawa and Montreal to restore affordability to where it stood over the past decade. However, in the case of Calgary and Edmonton, only marginal declines in prices would be needed.
- However, those estimates depend on where the equilibrium for affordability stands. If we think that affordability has deteriorated permanently to the long-term affordability level of Vancouver, only Toronto and Vancouver require a further drop in house prices.
- With house prices being overvalued and affordability at its lowest in decades, further declines in resale activity and house prices should be expected in Toronto, Ottawa and Montreal, and to a lesser extent Vancouver. However, a chronic lack of housing supply in those cities, both in terms of listings and new construction, and strong immigration, could prevent a sharp correction.
- In the case of Calgary and Edmonton, with valuation and affordability in line with the long-term average and strong migration, the need for a price correction is low. However, it does not mean that a decline in prices is impossible.
Earlier this year, before the Bank of Canada started to increase its policy rate, we updated our valuation metrics to assess the impact of rising interest rates on the Canadian housing market.
The objective was to have a starting point for our valuation metric ahead of the rate hikes. As we observed previously, low interest rates over the past decade have been a powerful force to keep affordability high, despite a continued increase in house prices.
As such, we noted an extreme divergence between housing valuation metrics that exclude interest rates from the ones that include interest rates. The former, like price-to-income, suggested that in many markets, especially in Toronto and Vancouver, house prices were reaching extreme overvaluation. However, once low interest rates were considered, valuation metrics like mortgage payments to income, while elevated, were more in line with historical averages.
Since the BoC began increasing interest rates, back in March 2022, the policy rate has increased by 400bp, while house prices, as measured by the Canadian Real Estate Association (CREA) house price index (HPI), have declined by about 10%.
In this report, we look at the impact on the valuation of both opposing factors, rising interest rates and a price decline. Moreover, with interest rates expected to remain elevated, we will look at what we should be expecting in terms of house prices in the coming years, especially as higher interest rates have led to a sharp decline in affordability in recent months.
The Impact of Interest Rates
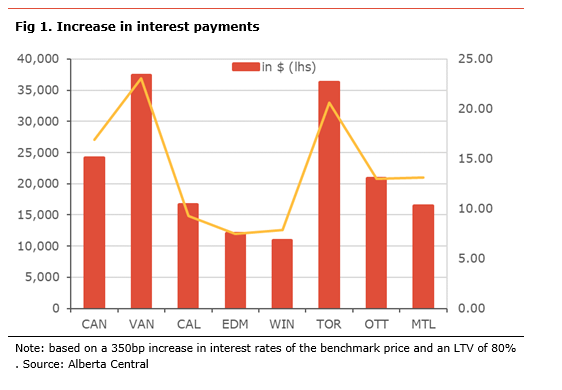
The increase in the interest rate, coupled with high price levels, are significantly raising the annual interest cost on the benchmark house price. Using the current national house price of $756k, the 400bp increase in interest rates means that a household pays $24,200 more in interest, annually, assuming a loan-to-value (LTV) of 80%. In high price markets like Vancouver and Toronto, it is $37,400 and $36,300, respectively. Nevertheless, even in markets where prices are lower, higher interest rates are also having a significant impact, raising interest costs by $10,900 in Winnipeg, $12,900 in Edmonton, $16,500 in Montreal and $16,700 in Calgary.
With such big changes in interest payments, it is not surprising that house prices have declined since interest rates started to increase, as an increasing share of households become priced out or have to turn to much cheaper homes.
Valuation metrics
Following the same methodology used in previous reports, we look at valuation metrics at a metropolitan level. As such, our analysis continues to focus on the main metropolitan areas in Canada: Vancouver, Calgary, Edmonton, Winnipeg, Toronto, Ottawa and Montreal. Altogether, these seven cities cover about 50% of the Canadian population.
We also continue to use the same valuation metrics as in the original piece: house price relative to income, house price relative to rent, mortgage payments relative to income, mortgage payments relative to rent, and required income to afford the average house (see Appendix for detailed results).

Whether an asset is overvalued or not is often subjective as there are no defined levels; i.e., equilibriums are hard to identify and time-varying due to structural changes. Therefore, we focus on the difference between the current level of a metric and “normal” level of this metric, or the level of various indicators over the past 40 years. For this reason, we focus on the deviation of the various metrics relative to their historical mean using the Z-score (see Appendix for background on Z-score).
This point is important because housing markets are local and depend on local conditions. For example, conditions in Vancouver have meant that prices have generally been higher than elsewhere in the country for the past four decades. Yet, someone living in the city knows and understands that this is the reality of living there and will plan accordingly. Someone in Vancouver is unlikely to consider a house in Winnipeg or Edmonton, even if the real estate is much cheaper, because commuting is practically impossible due to the commuting cost[1].
Key valuation findings:
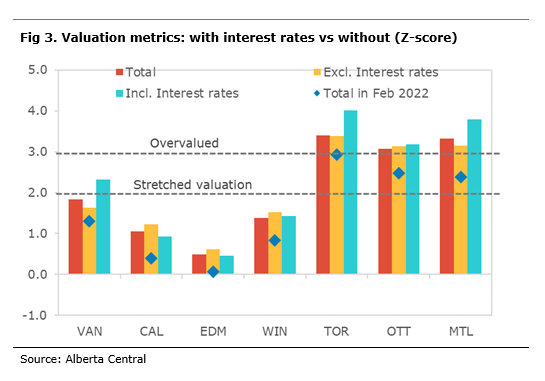
- In general, most valuations have moved further into the overvalued territory since February 2022, with the exception of the price-to-rent, as house prices declined while rents continued to increase strongly throughout the country.
- Declining house prices in some cities are easing some of the overvaluation for some measures. As such, we are seeing a decline in price-to-income. The easing in house prices has been more pronounced in markets that were identified as overvalued, such as Toronto, Ottawa and Vancouver. However, despite the decline in prices, these markets are well into in overvalued territory with a Z-score above 3.
- However, the moves have been more substantial in measures that include interest rates compared to those without. As such, valuation metrics that include interest rates have increased by more than a full standard deviation, with the biggest moves in Montreal (+1.9) and the smallest in Edmonton (+0.9).
- We note that three markets, Toronto, Ottawa and Montreal, have the average Z-score of their various measures well above 3, suggesting an extremely overvalued market.
- In Vancouver, despite very high house prices and elevated valuation metrics, the Z-score of these measures only suggest moderate overvaluation. This is because the Vancouver housing market has always been expensive from a historical perspective.
- In the case of Calgary, Edmonton and Winnipeg, the average valuation metrics, while above historical average, do not show signs of excessive overvaluation, with Edmonton only marginally above its long-term average.
[1] The increased prevalence of remote-working arrangement post-COVID19 pandemic could make such a situation possible, but it is too recent and not yet broadly used to influence the current analysis.
An affordability tug-of-war: interest rates vs prices
Since the peak of the housing market earlier this year, we have seen a tug-of-war on affordability between higher interest rates and lower prices in many markets. So far, higher interest rates have been more powerful, reducing affordability significantly. We can see the combined impact of rising interest rates and lower house prices when looking at the required income measure[2], both in level and relative to income, and the average mortgage payment relative to income.
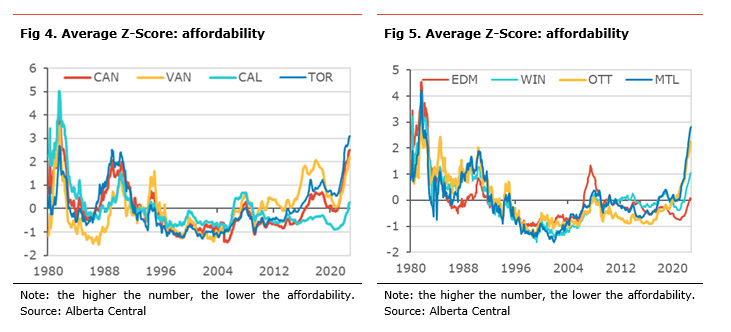
Looking at the affordability measures combined, affordability has deteriorated in every city. The deterioration has been, unsurprisingly, more significant in areas where house prices were found to be overvalued. We make the following observations:
- Affordability in Toronto has never been this low before. This is based on 40 years of data that included the early 1980s when interest rates were around 20%.
- Montreal, Ottawa, and Vancouver are at their most unaffordable since 1981. This is again a period when interest was close to 20%.
- For Calgary, Edmonton and Winnipeg, affordability is only slightly below their long-term average. Hence, there are little concerns regarding those markets.
[2] an estimate of required family income to keep mortgage payments below 25% of income, at current interest rates. The idea behind this measure is that banks will usually require total housing costs (mortgage, property taxes, insurance, condo fees and heating costs) to be below 30% of income to qualify for a mortgage.
Required income
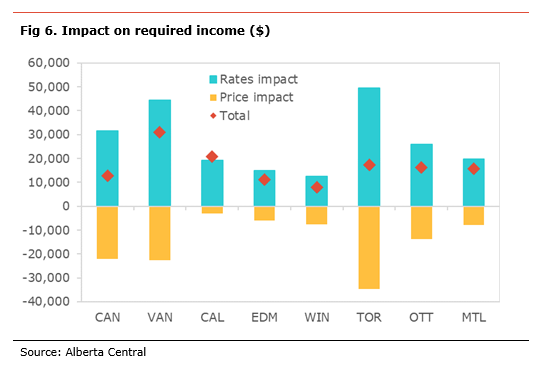
On average, the required income to purchase the benchmark house in Canada has increased by about $12,600 since February. The biggest increase in this measure has been in Vancouver ($31,100), Calgary ($20,800), Toronto ($17,200) and Montreal ($15,200). The smallest increases have been in Winnipeg ($8,000), Edmonton ($11,300) and Montreal ($15,600).
In Toronto, a family needs an income of $254,200 to afford the average house in the city (1.7 times the average family income); this is $15,400 more than back in February. In Vancouver, it is $252,800 (1.8 times income) and about $21,700 more than in February. The required income in Calgary has increased significantly because, in contrast to other cities, house prices have continued to increase and have yet to peak. Moreover, despite the sharp increase in recent months, the measure remains only mildly above its historical average, suggesting the city remains affordable.
Affordability based on this measure is reaching extreme lows in Toronto, Ottawa and Montreal, with Z-scores well above 3. Vancouver is not far behind with a Z-score of 2.9. Calgary, Edmonton and Winnipeg have Z-scores of 0.8, 0.5 and 1.7, respectively, suggesting that affordability is only marginally below their long-term averages.
If we assume that interest rates would have stayed at the level they were in February, based on the interest rate on a new fixed-rate mortgage according to BoC data, the decline in house prices nationally of about 10% since February would have reduced the required income by almost $22,100. In Toronto, prices have declined by $34,800, thanks to an 11% decline in house prices. In Alberta, the required income would decrease by a meager $3,100 in Calgary and $6,000 in Edmonton, mainly due to the gradual increase in income over the period rather than because of easing prices.
If we assume that house prices would have stayed at the level they were in February, based on CREA’s benchmark price, the 350bp increase in interest rates would have pushed the required income by $31,400 nationally. In high price cities, it would have jumped by $49,400 in Toronto, $44,500 in Vancouver, and $25,900 in Ottawa. The impact would also have been significant in areas with lower prices, with the measure increasing by $12,500 in Winnipeg, $14,800 in Edmonton and $19,000 in Calgary.
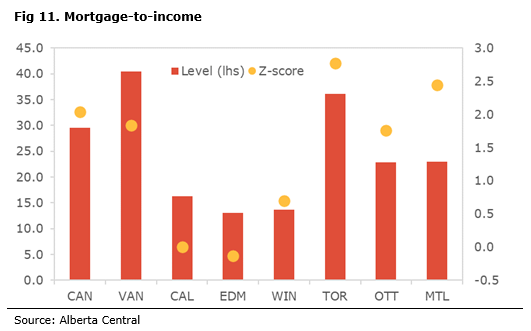
Mortgage-to-income
On average, Canadian households must spend about 29.6% of their income in mortgage payments at current interest rate and house prices. This is almost 3 percentage points higher than in February, its highest level since 1990. The biggest change has been in Vancouver (+5.6pp), Montreal (+3.9pp), Calgary (+3.3pp) and Ottawa (+2.8pp). In Toronto, the decline in house prices has meant that mortgage payments relative to income rose by 2.7pp, its highest level since 1981.
Based on this measure, Toronto and Montreal are in very unaffordable territory with a Z-score of 2.8 and 2.4, respectively. In Calgary and Edmonton, the measure is in line with the average level over the past 40 years.
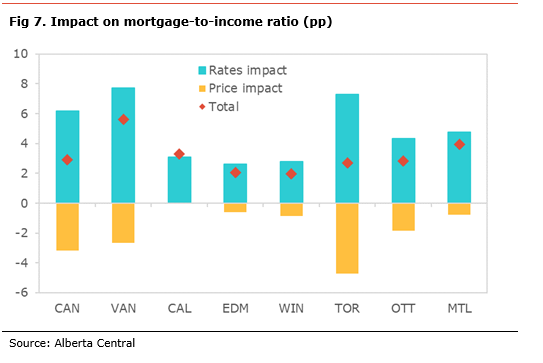
If we assume that interest rates would have stayed at the level they were in February, the mortgage-to-income ratio would have eased by 3.2pp nationally, thanks to lower prices. The biggest moderation would have been, unsurprisingly, in Toronto (-4.7pp) as prices declined significantly. At the other end, the ratio would have been unchanged in Calgary, as house prices in the city have yet to peak.
If we assume that house prices would have stayed at the level they were in February, the mortgage-to-income ratio would have increased by 6.2pp nationally. As expected, the biggest increase would have been in the cities where prices are the highest, Vancouver (+7.7pp) and Toronto (+7.3pp). Even in cities with lower house prices, the impact would have been significant, with increases of 2.0pp in Winnipeg and 2.1pp in Edmonton.
How much prices have to decline to restore affordability
As we have shown, rising interest rates have had a major impact on affordability in all major Canadian cities. While in some markets (Calgary, Edmonton and Winnipeg), affordability measures are close to the historical average, others, like Toronto, Vancouver, Ottawa and Montreal, are seeing affordability deteriorate to levels not seen in decades. Already, we are seeing some price adjustments in many markets restoring some of the lost affordability, but with little success so far.
The question for the evolution of the Canadian market is how much do prices need to decline to restore affordability. This is not an easy question to answer. It depends heavily on the level of affordability that one believes should be the equilibrium; i.e. what should be the equilibrium level for the mortgage-to-income ratio or the required income to buy the average price.
In this section, we estimate how much house prices would need to decline to bring the various affordability measures to various points in times. In other words, how much lower house prices need to be to restore affordability to levels that prevailed at different points in time:
- In January 2020 at the eve of the pandemic.
- The average level of the affordability indicators between 2009 and 2019. This period looks at affordability over the recent long period of low interest rates.
- November 2018, the point where interest rates peaked in the previous hiking cycle.
- The average level of affordability since 1980.
Using these various scenarios, we estimate that to restore affordability, house prices in Canada would need to decline by a further 25% to 42%, depending on the hypothesis regarding the equilibrium. In the case of Toronto, the correction needed is between 29% and 51%, while it is between 3% and 45% for Vancouver. For Montreal and Ottawa, the range for both is between 29% and 36%.
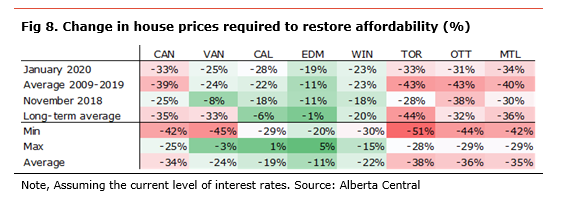
In Calgary and Edmonton, these scenarios suggest that house prices would need to decline by as much at 29% and 20% to restore affordability. However, these calculations do not take into consideration that it would bring back affordability above its long-term average. In fact, affordability is at its long-term average, while in Edmonton, prices need to rise by 5% for affordability to decline to its long-term average.
As a counterargument, we also make a simulation assuming that the new affordability equilibrium is Vancouver’s long-term average for those measures. The reasoning for this is that, since Vancouver has always had lower affordability than other cities in Canada over history without price corrections, maybe the affordability equilibrium elsewhere could have structurally declined to be in line with Vancouver, i.e. that housing will be permanently more expensive in Canada.
Using this scenario, only Vancouver and Toronto would need a drop in price to restore affordability, by 35% and 31%, respectively. In all the other cities, house prices could rise further. In the case of Calgary and Edmonton, prices would need to double to bring affordability in line with the historical average of Vancouver. This shows how the choice of what the equilibrium for affordability is influences how much house prices need to correct.
Outlook for the housing market
The Canadian housing market remains overvalued by many metrics and the increase in interest rates over the past year has only made matters worse. As such, affordability is at its lowest since 1990 in most major cities: Vancouver, Toronto, Montreal and Ottawa. In the case of Toronto, affordability hasn’t been this low since the early 1980s.
The lack of affordability will have a big impact, as many buyers are either fully priced out or need to look at cheaper alternatives, either smaller or further away from city centers. This will likely continue to constrain resale activity and hold back prices. As such, with interest rates unlikely to decline significantly in the coming year, further declines in house prices should be expected to restore some affordability.
The big uncertainty to the outlook, as mentioned in the previous section, is where is the new equilibrium for affordability is unknown. It is very likely that because of the lack of housing supply in those cities, both in terms of listings and new construction, and strong immigration, affordability is structurally lower. This means that the correction needed may be smaller than suggested by the simulation in the previous section. Nevertheless, these simulations also suggest that the likelihood of a sizeable correction in house prices, as much as 20%, remains high in the Greater Toronto area. Similarly, Ottawa, Montreal and Vancouver are also vulnerable and could also see some significant declines to restore affordability.
In the case of Calgary and Edmonton, since affordability and valuation are near their long-term average, there is much less need for a decline in house prices. In terms of resale activity, we should expect to see some further moderation in activity, as households remain cautious with their finances, and some may be priced out by higher interest rates. Moreover, continued positive migration to the province will help sustain demand. Hence, we do not expect any meaningful declines in house prices.
Watch the labour market
Household debt levels are very close to record in Canada and higher interest rates are raising the cost of servicing this debt. Borrowers with variable rate mortgages are feeling the pinch from higher interest rates, either through higher payments or a lower share of their payments going to repay the principal. In some cases, their monthly payments no longer fully cover their interest payments. Nevertheless, so far, financial institutions have shown flexibility is helping borrowers and avoiding defaults. Similarly, borrowers coming at renewal of their mortgages are also facing higher interest rates. However, they also have some flexibility to face the higher interest payments by extending their loan maturity.
One of the biggest risks for the housing market may be a sharp deterioration in the labour market. The Canadian economy is expected to be in recession in early 2023 and should lead to a rise in the unemployment rate. With a high debt level and debt-service cost, many households are relying on two incomes to service their debt. The concern is that job losses would lead to households not being able to service their debt anymore.
This could be the moment where many households are forced to sell their homes, as they can no longer make their mortgage payments. This wave of forced selling could exacerbate any price declines expected in 2023 and lead to an increase in defaults.
Conclusion
The valuation metrics and the simulations show that further price declines are required in most major cities in Canada to restore affordability. What is unclear is how much further prices have to ease. The need for more declines in house prices is more important in Toronto, followed by Montreal, Ottawa and Vancouver, in order of potential correction size.
In the case of Calgary and Edmonton, with valuation and affordability in line with the long-term average, the need for a price correction is low. However, it does not mean that a decline in prices is not a possibility. Moreover, positive migration to the province should help support demand and prices.
Appendix
Z-score
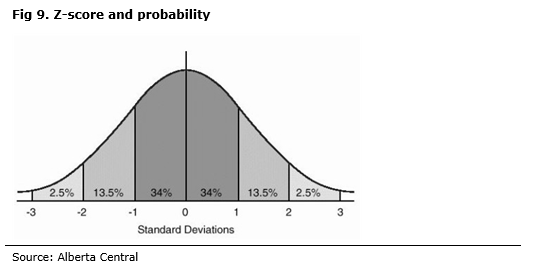
The Z-score measures how far away from the historical average the observation is in terms of standard deviation. As such, a Z-score of 0 indicates that the observation is on the historical average. A negative score means that it is below, while a positive score indicates it is above.
Moreover, the property of the Z-score shows how likely such an observation is, based on history. The chart below shows that about 68% of all the historical observations fall between a Z-score of -1 and +1 and 95% have a Z-score between -2 and +2. This is useful as it means that a Z-score above 2 only happens 2.5% of time. In our current analysis, this means that a metric with a Z-score of higher than 2 only happened 12 times between 1980 and 2021, based on 495 observations.
Using those properties of Z-score, we defined a metric with a Z-score between 1 and 2 as having a stretched valuation. Once the Z-score is above 2, we will define the measure as being overvalued. It is important to keep in mind that, using the Z-score to define valuation, we are making the assumption that the metric was fairly valued over the sample studies.
House price to income
This indicator is simply the average house price divided by the average family income in the city. It shows how many years of income would be needed to pay for a house if all the income went towards purchasing a house. With some manipulations and without changing any conclusions, it also shows how many years it will take for the average household to accumulate enough for the down payment needed for purchasing a house (dividing by 5 for the time to accumulate 20% down payment and by 10 for a 10% down payment)[3].
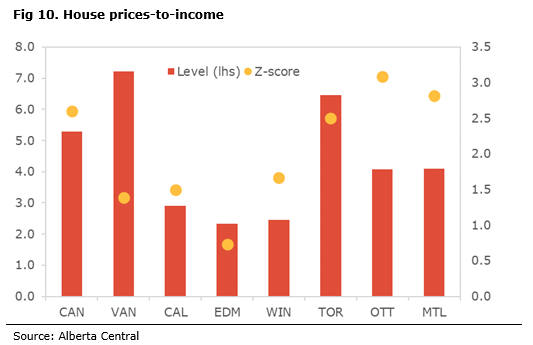
Based on this measure, it takes 5.3 years for the average Canadian household to pay for a down payment in Canada, lower than in February thanks to the decline in house prices. However, there are some important divergences. For example, in Vancouver, it would take 7.2 years and in Toronto 6.5 years, while it would only take 2.3 years in Edmonton, 2.4 years in Winnipeg and 2.9 years in Calgary.
However, as we said previously, while the level of the indicator is interesting, its deviation relative to average is more indicative of valuation issues. This is especially true for Vancouver and Toronto, where the indicator has been higher than other cities for most of the past four decades.
Putting it in a historical context, on average in Canada, it took 2.2 years in the 1980s, 2.5 years in the 1990s, 2.8 years in the 2000s and 3.9 years on average since 2010 to save for a down payment. These calculations show the scope of the rapid rise in house prices compared to family income over the past two decades.
Using the Z-score to evaluate the amount of overvaluation, the Canadian average makes it significantly overvalued with a score of 2.6. Ottawa at 3.1 and Montreal at 2.8 are also considered significantly overvalued. Toronto at 2.5 is overvalued, but less than at the beginning of the year. Vancouver at 1.4, Winnipeg at 1.7 and Calgary at 1.5 are in the stretched territory, while Edmonton at 0.7 does not show any signs of overvaluation.
In all cases, both the levels of the indicator and its Z-scores have decreased since our February calculations. This is the result of house prices having decreased while income continued to rise over the period.
Mortgage to income
While price-to-income is an interesting measure, it is incomplete and fails to consider a significant economic trend of the past 40 years: the gradual decline in interest rates, reaching a record low during the pandemic.
Over the past four decades, the decline in interest rates has led to a gradual but sizeable improvement in affordability. This means that households had lower mortgage payments for the same house price, or, for the same mortgage payment, they could afford a more expensive house. Moreover, when a household considers buying a house, the size of the monthly payment often matters more than the actual price.
For this reason, the second valuation we consider is the mortgage payment relative to income. This measures the share of income an average family in each city would be spending if they purchased a house at the average price for their city with a 20% down payment, at current mortgage rates and on a 25-year amortization.
Based on this measure, an average Canadian family would spend about 30% of its income on their mortgage payment buying an average Canadian house. A sharp rise from the 25% estimated in February. There are also some important divergences between cities.
At the upper end of the spectrum, families in Vancouver could expect to spend 40% of their income on mortgage payments. In comparison, a family in Edmonton should expect to use 13% of its income to cover both interest and principal payments.
While the level indicates the pressure house prices are putting on household finances, how these pressures compare to historical norms also matter.
Once again, using the Z-score, we find that Toronto at 2.8 and Montreal at 2.4 would be considered overvalued, while Vancouver and Ottawa, both at 1.8, would have a stretch valuation. Interestingly, despite the sharp rise in interest rates, Calgary and Edmonton, with scores close to 0, have affordability in line with long-term average.
Minimum required income
Another way of looking at affordability is to estimate what family income is required to be able to buy the average house in each city. We start with the premise that most banks require housing costs (mortgage, property taxes, heating costs, condo fees and insurance) to be, at most, 32% of the borrowers’ income to approve the loan. Based on this, we assumed that to not exceed 32% of income in housing costs, mortgage payments alone should be at most 25% of the average family income at current interest rates and house prices.
In addition, we also look at the level of required income relative to the average family income in the city. The idea is that, if the required income is above the average family income, it indicates that the “average” family can no longer afford the “average” house in the city, hence suggesting some affordability issues.

Based on this indicator, the least affordable housing market is Vancouver, where an average family requires a family income of more than $262,000 to buy the average house or 1.9 times the average income. The second least affordable housing market is Toronto, where a family income of a little more than $254,000 is required, or 1.7 times the average income. At the other end of the spectrum, Edmonton and Winnipeg are the most affordable with a required income of about $85,000 (0.6 times average) and $76,000 (0.6 times average), respectively.
Price to rent
The previous indicators look primarily at housing affordability. However, households have the choice between owning or renting a home. Hence, if ownership costs become disproportionately high compared to the rental cost, some households may decide to rent rather than buy.
We consider house price relative to rent. This measure can be interpreted as the number of years a household would have to be renting to have spent the same amount of money as owning a house.
It is important to note that the comparison is not perfect because it doesn’t take into account the maintenance costs a homeowner would face, which have been a big source of inflation recently, and its mortgage payments. It also doesn’t account for the fact that owning a house is an asset on the household balance sheet.
Based on this measure, it would take 68 years renting in Toronto to have spent the same amount as buying a house. In Vancouver and Ottawa, it is 66 years and 37 years, respectively. At the other end of the spectrum, it would take 19 years in Winnipeg, 21 years in Edmonton, 29 years in Montreal and 27 years in Calgary.
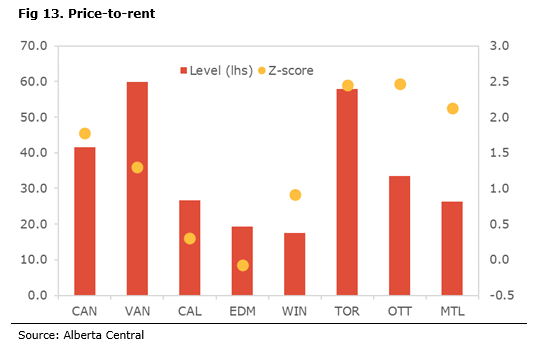
Relative to history, Toronto and Ottawa stand out with Z-scores of 3.5 and 3.4, respectively, suggesting that house prices are significantly overvalued compared to the rental cost. Similarly, Montreal has a score of 2.7. The least overvalued cities are Calgary and Edmonton, both with scores close to 0. Like the price-to-income and for the same reasons, Vancouver is in stretched territory with a score of 1.8.
The very low level of house prices relative to rent in Calgary and Edmonton, both in level and historically, compared to other metropolitan areas, likely explains the continued influx of investors into the Alberta housing market in recent months.
Mortgage to rent
When households consider whether they should buy or rent, an important factor they are likely to consider is how much they would have to spend monthly. Hence, they compare their monthly mortgage payment relative to what the monthly rent would be.
Using the same mortgage payment estimated previously, we look at mortgage payments relative to rental cost. As with the previous measure, it does not take into account homeownership costs such as repairs and maintenance, property taxes, etc.
As was the case previously, this allows us to take into account the record low level of interest rates. This measure also shows how big the average mortgage payment in the city is relative to the average rent.
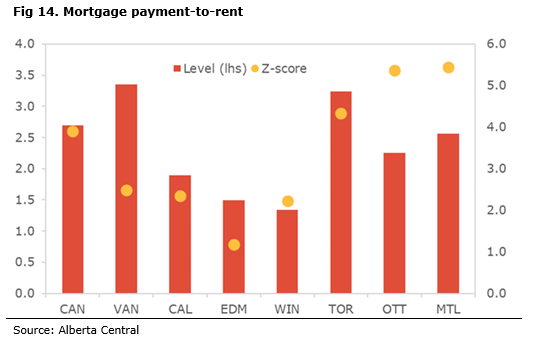
Based on this measure, families in Toronto should expect, on average, to pay 3.0 times more in monthly mortgage payments than in rent. This proportion is 2.9 times in Vancouver, 2.2 times in Montreal and 2 times in Ottawa. In Winnipeg, households would be expected to pay 1.1 times their monthly rent. The ratio is 1.2 and 1.5 in Edmonton and Calgary, respectively.
When looking at the Z-score, it is clear that households in Toronto, Ottawa and Montreal spend significantly more on mortgage payments than on rent compared to historical norms. All three cities have scores well above 3 at 3.6, 3.6 and 3.4, respectively, meaning that these markets are in overvalued territory.
On the other end of the spectrum, with values slightly below 0, the markets of Edmonton (-0.1) and Calgary 0.4) have mortgage payments relative to rent close to their long-term averages. The measure for Vancouver (1.8) is also above historical norms, but not into overvalued territory.
Mortgage interest payment to rent
While households compare their monthly mortgage payments and rent when deciding whether to purchase a house, a mortgage payment is not fully comparable to rent.
As such, the part of the mortgage payment that covers principal repayment could be considered as forced savings and increases the household’s net worth. Essentially, it could make sense for a household to stretch its mortgage payment relative to rent, especially in a low interest rate environment. With this in mind, we consider the size of the first mortgage interest payment relative to rent.
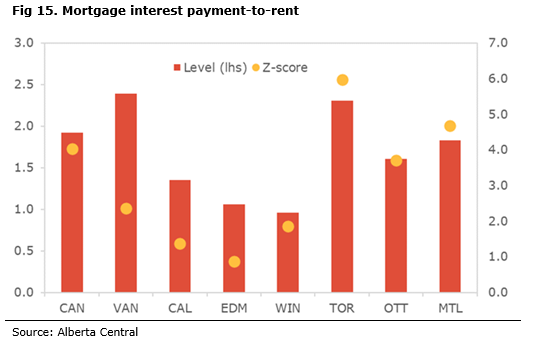
In level, the mortgage interest payment relative to the monthly rent is the highest in Vancouver (1.5), Toronto (1.5), Montreal (1.1) and Ottawa (1.0). Conversely, it is the lowest in Winnipeg (0.6), Edmonton (0.6) and Calgary (0.8).
Compared to the historical average, none of the cities considered have a Z-score that suggests some potential issues, with Toronto and Vancouver into stretch territory with scores of 1.5. The measure is below average in Winnipeg, Calgary, Edmonton and Vancouver, while it is slightly above average in Montreal and Ottawa. However, it is important to stress that this situation is because the level of interest rates is still low by historical standards.
The general conclusion from the various valuation metrics is that rising interest rates are pushing valuation metrics for many cities in Canada deeper into overvalued territory, especially in Toronto, Ottawa, and Montreal, despite the decline in house prices in many cities. This means that affordability is declining rapidly, as interest rates increase.
[3] It is important to note that the house prices average in Vancouver and Toronto is above the $1 million and no longer qualify for the mortgage insurance from CMHC.
Independent Opinion
The views and opinions expressed in this publication are solely and independently those of the author and do not necessarily reflect the views and opinions of any organization or person in any way affiliated with the author including, without limitation, any current or past employers of the author. While reasonable effort was taken to ensure the information and analysis in this publication is accurate, it has been prepared solely for general informational purposes. There are no warranties or representations being provided with respect to the accuracy and completeness of the content in this publication. Nothing in this publication should be construed as providing professional advice on the matters discussed. The author does not assume any liability arising from any form of reliance on this publication.
Alberta Central member credit unions can download a copy of this report in the Members Area here.