Economic insight provided by Alberta Central Chief Economist Charles St-Arnaud
Bottom line
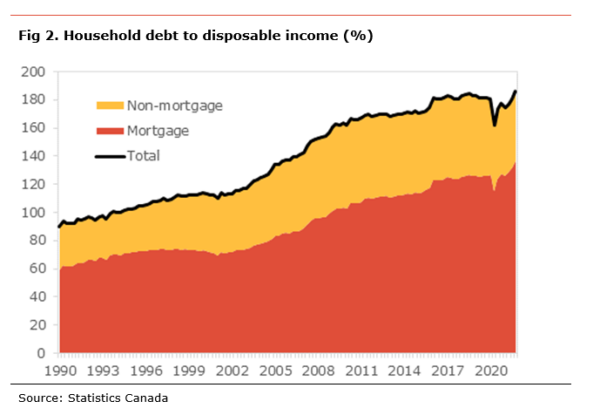
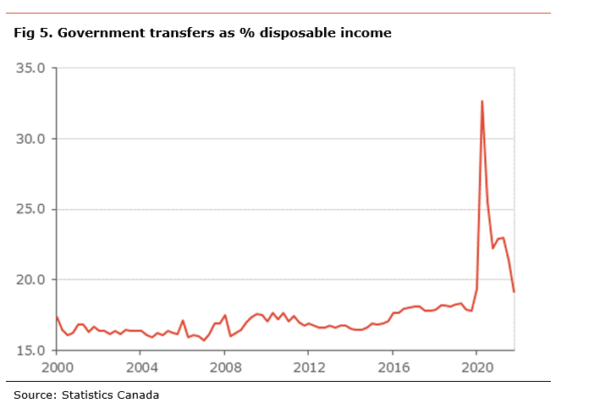
Household indebtedness has been a significant concern and risk for the economy for some years. After a sizeable improvement in 2020, households’ debt-to-disposable income ratio increased to its highest level on record in the fourth quarter of 2021 due to a continued increase in debt level and a decline in disposable income. The decline in disposable income results from a normalization in government transfer payments, as COVID-related income-support programs are gradually phased out.
As a result of a further increase in indebtedness and the decline in disposable income, the debt-service ratio increased to 13.8%. Nevertheless, the debt-service ratio is a whole percentage point below its pre-pandemic level, mainly due to lower interest rates.
With indebtedness reaching a record high, it poses some concerns regarding the impact of incoming interest rates increases on households’ ability to service their debt. A normalization in interest rate from the current record low levels is likely to be a headwind on consumer spending, as households will need to divert some of their income from discretionary spending to debt repayment. In addition, households are phasing increased pressure on their budget and purchasing power from rising inflation.
However, households have accumulated a significant amount of saving during the pandemic, about $310bn. Whether they spend, repay their debt or keep that amount as saving will matter for the outlook.
The ratio of household debt to disposable income increased in the fourth quarter, rising to 186.2%, the higher on record. This means that households owe on average $1.86 in debt for each dollar earned. The ratio’s sharp deterioration in the ratio, increasing by 5.8 percentage points (pp), was the result of the level of debt rising on the quarter (+1.8% q-o-q) while disposable income declined (-1.3% q-o-q).
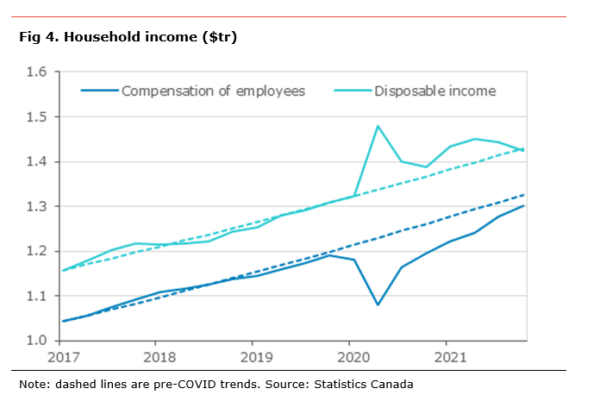
The decrease in disposable income resulted from a decline in government transfer (-11.9% q-o-q) as some government income-support programs are either phased out or become less generous. On the other hand, compensation of employees rose +1.9% q-o-q as more people were working in the fourth quarter. Since the start of the pandemic, the increase in government transfer has been responsible for about a quarter of the rise in disposable income.
On the debt side, the increase in total household debt was mainly due to a rise in mortgage debt (+2.4% q-o-q), while non-mortgage debt saw a more modest rise on the quarter (+0.7% q-o-q), with both non-mortgage loans and consumer credit contributing.
Since the start of the pandemic, household debt to disposable income has increased by 5.2pp. The deterioration in the indebtedness ratio happened entirely in the fourth quarter of 2021. We estimate that if it were not for the improvement in the disposable income due to increased government transfer, the indebtedness ratio would stand at 188.4%.
The debt-service ratio, the share of income households need to spend to repay the interest and obligated principal payment on their debt edged lower to 13.8% from 13.5%. This means that, for each dollar earned, households need to spend $0.14 to service their debt. The increase resulted from the decline in disposable income, increasing the ratio by 0.2pp, and higher debt payment, contributing +0.1pp to the ratio.
The details show that the rise in debt payment resulted from an increase in the obligated payment of principal (+1.8% q-o-q) as the debt load continues to increase. With interest rates remaining low, interest payments declined on the quarter (-0.4% q-o-q), likely as households managed to refinance some of their existing debt at lower rates.
Since the start of the pandemic, the debt-service ratio has eased by 1.0pp, with the decline coming exclusively from higher disposable income. While the contribution from debt payments is unchanged overall, an increase in principal repayment, in line with rising debt levels, has been fully offset by lower interest payments, as interest rates remain close to a record low. This suggests that, as interest rates increase, a greater share of household income will need to be diverted towards interest payments, likely reducing discretionary spending. Moreover, the details show that only non-mortgage debt contributed to the lower debt-service ratio, as mortgage debt continued to increase over the period.
The household saving rate declined to 6.4%, its lowest since the start of the pandemic. The lower saving rate was due to a bigger rise in consumer spending than in income, as the economy continued to reopen, and to a. According to the national balance sheet data, households have accumulated almost $310bn in saving since the start of the pandemic. Of this amount, about $105bn is held in bank deposits, and about $200bn has been invested in equity and investment funds.


Independent Opinion
The views and opinions expressed in this publication are solely and independently those of the author and do not necessarily reflect the views and opinions of any organization or person in any way affiliated with the author including, without limitation, any current or past employers of the author. While reasonable effort was taken to ensure the information and analysis in this publication is accurate, it has been prepared solely for general informational purposes. There are no warranties or representations being provided with respect to the accuracy and completeness of the content in this publication. Nothing in this publication should be construed as providing professional advice on the matters discussed. The author does not assume any liability arising from any form of reliance on this publication.
Alberta Central member credit unions can download a copy of this report in the Members Area here.