Economic insight provided by Alberta Central Chief Economist Charles St-Arnaud.
Bottom line
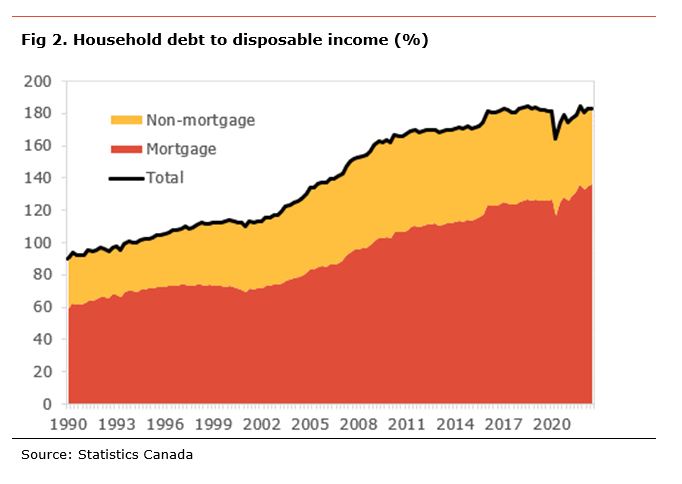
Household indebtedness has been a significant concern and risk for the Canadian economy for some years. After a sizeable improvement during the pandemic, households’ debt-to-disposable income ratio is close to its highest levels on record at 183.3%. In recent quarters, a continued increase in disposable income has offset the impact on indebtedness of a continued rise in debt.
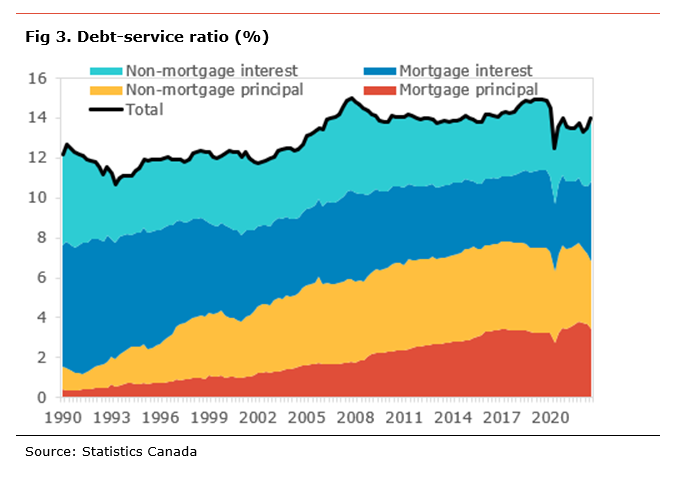
As a result of the increase in interest rates, the debt-service ratio rose to 14.0% from 13.5% in the third quarter. Interestingly, despite a continued increase in the level of debt, obligated principal payments decreased on the quarter. This could be the result of a smaller share of payments going to the principal in the case of borrowing at variable rates but with fixed periodic payments and to some borrowers extending the amortization period of their debt to offset the increase in interest rates.
With indebtedness close to a record high and the Bank of Canada having increased interest rates sharply, 400bp since the beginning of the year, there are some concerns regarding the impact of those interest rate increases on households’ ability to service their debt. We are already witnessing a sharp rise in the debt-service ratio and further increases are likely as more borrowing gets renewed at higher interest rates.
As mentioned, households are already reducing their principal payments to offset the pressures from higher interest payments, easing the negative impact on their budget. This flexibility is likely to help contain defaults for now. However, a big risk is that the situation could become unsustainable if the upcoming recession proves deeper than expected, leading to significant job losses.
Households have accumulated significant savings during the pandemic, about $370bn, potentially providing some buffer. However, whether they spend, repay their debt or keep that amount as savings will matter for the outlook. The increase in saving and the decline in spending in the third quarter points to some caution from consumers.
The ratio of household debt to disposable income increased in the Third quarter of 2022, rising to 183.3%. This means that households owe on average $1.83 in debt for each dollar earned. The deterioration in the ratio, increasing by 0.7 percentage points (pp), was the result of the level of debt rising on the quarter (+1.2% q-o-q) while disposable income increased a more modest (0.8% q-o-q).
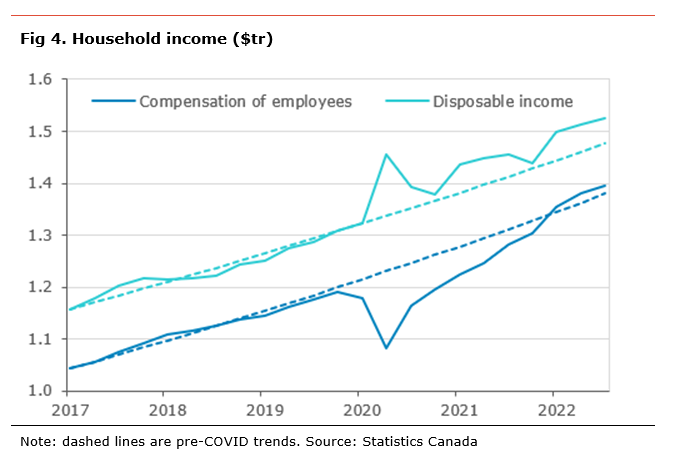
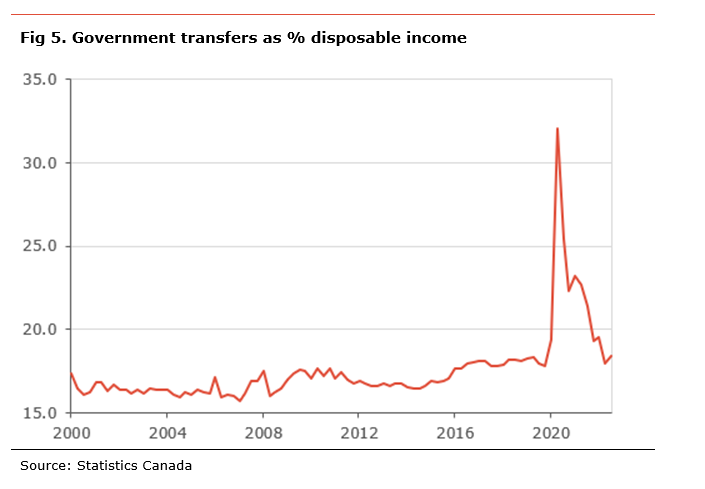
The increase in disposable income resulted from an increase in compensation of employees of 1.2% q-o-q and an increase in government transfers (+3.1% q-o-q). Those increases were partly offset by a decline in property income (-3.6% q-o-q) and an increase in transfers paid (+1.7% q-o-q). After being a big source of income during the pandemic, the government transfer in disposable income increased slightly to 18.4% from 18.0%, but still in line with pre-Covid levels.
On the debt side, the increase in total household debt was mainly due to a rise in mortgage debt (+1.3% q-o-q), while non-mortgage debt saw a smaller rise on the quarter (+0.9% q-o-q), with both non-mortgage loans and consumer credit contributing.
Since the start of the pandemic, household debt to disposable income has increased by 2.1pp. We estimate that if it were not for the continued rise in disposable income, the indebtedness ratio would stand at 213.8.4%. Conversely, if households didn’t accumulate debt over the period, the ratio would be 155.3%.
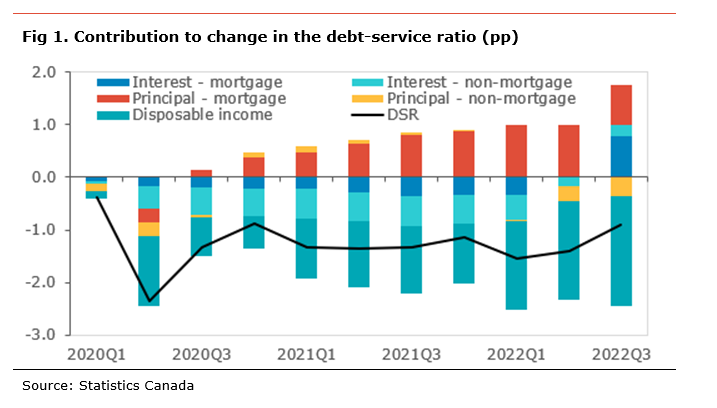
The debt-service ratio, the share of income households need to spend to repay the interest and obligated principal payment on their debt, increased to 14.0% from 13.5%. This means that, for each dollar earned, households need to spend $0.14 to service their debt. The increase resulted from the decline in disposable income, increasing the ratio by 0.2pp, and higher debt payment, contributing +0.1pp to the ratio.
The details show that the rise in debt payment resulted from an increase in the interest payments (+7.5% q-o-q) as interest rates increased sharply over the quarter. Despite an increase in debt levels, obligated principal payments declined on the quarter (-2.0% q-o-q). This could be the result of a greater share of fixed debt payment on variable rate debt having to be redirected away from principal payment to cover the increase in interest payments.
Since the start of the pandemic, the debt-service ratio has eased by 0.9pp, with the decline coming exclusively from higher disposable income. At the same time, the contribution from debt payments is higher by 1.4pp, with most of the increase coming from higher interest payments (contributing +1.0pp). Since the Bank of Canada started to increase interest rates, debt payments have increased by 1.3pp. With more rate increases in the fourth quarter and borrower renewing at higher rates, we should expect further rises in interest payments. Moreover, most of the increase is coming from mortgage debt payments (+1.6pp), while it declined for non-mortgage (-0.2pp). The continued growth in disposable income helped hold back the debt-services ratio, contribution -2.1pp.
The household saving rate rose to 5.7% from 5.1%. The higher saving rate was due to a bigger rise in income, while consumer spending declined on the quarter. According to the national balance sheet data, households have accumulated almost $370bn in saving since the start of the pandemic. Of this amount, about $215bn is held in bank deposits, and about $150bn has been invested in equity and investment funds.
Independent Opinion
The views and opinions expressed in this publication are solely and independently those of the author and do not necessarily reflect the views and opinions of any organization or person in any way affiliated with the author including, without limitation, any current or past employers of the author. While reasonable effort was taken to ensure the information and analysis in this publication is accurate, it has been prepared solely for general informational purposes. There are no warranties or representations being provided with respect to the accuracy and completeness of the content in this publication. Nothing in this publication should be construed as providing professional advice on the matters discussed. The author does not assume any liability arising from any form of reliance on this publication.
Alberta Central member credit unions can download a copy of this report in the Members Area here.