Economic insight provided by Alberta Central Chief Economist Charles St-Arnaud.
Bottom line
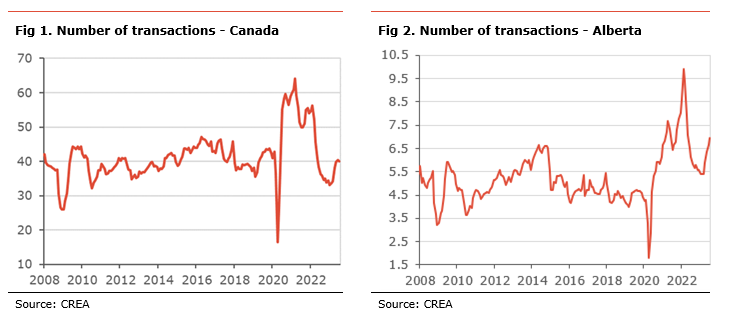
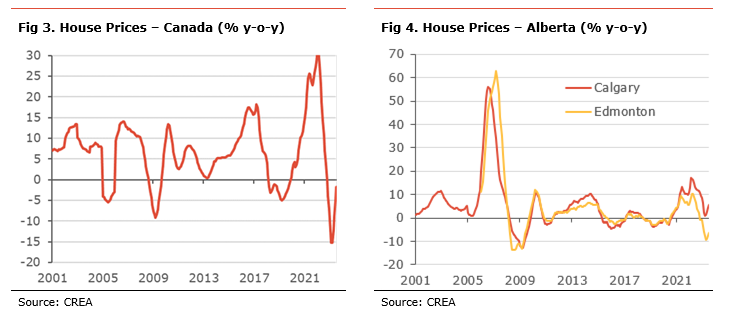
Housing activity declined in July for the first time in five months, while national house prices rose again but remained almost 10% below their peak nationally. The decline in housing activity comes after the Bank of Canada increased its policy rate in June and July. Moreover, continued low inventories are likely to constrain activity and provide further support to house prices.
In Alberta, housing market activity remained robust by historical standards. However, we note a continued divergence between the metropolitan areas. Prices in Calgary have continued to increase over the past year, and the city remains one of the strongest housing markets in Canada, supported by low inventories and strong population growth. On the flip side, Edmonton continues to underperform as inventories remain higher. Strong migration into Alberta is a major support for activity and prices compared to elsewhere in the country.
Low interest rates have been one of the main drivers of the housing market, supporting affordability. Despite affordability being at its lowest in decades in many cities (see), housing demand is picking up, supported by the strong labour market, potential buyers resetting their expectations of what they can afford and a fear of missing out. It will be interesting to see whether the 50bp increase by the Bank of Canada will continue to have a cooling impact on the housing demand or if the effect will be temporary. The continued lack of supply in many regions and increased immigration will likely continue to support house prices and prevent further correction, with the health of the labour market likely the key to the outlook for the housing market.
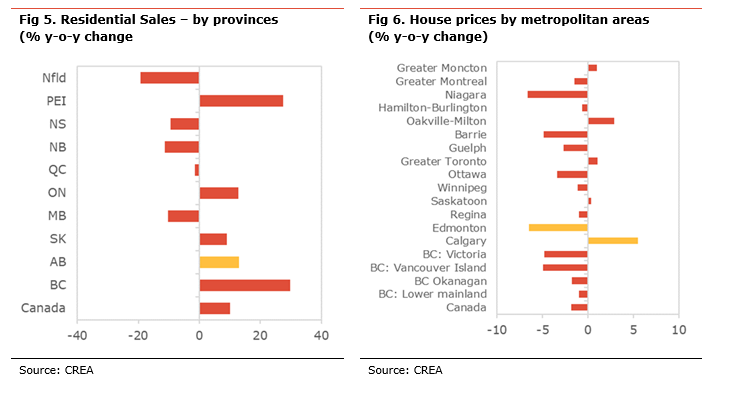
Activity in the Canadian housing market eased by 0.7% m-o-m seasonally-adjusted in July. As a result, the number of transactions, at 40.0k, 10.1% higher than for the same month last year. In July, activity was lower in half of the provinces, led by Ontario, BC, Newfoundland, Nova Scotia, and New Brunswick. In Alberta, the number of transactions rose (+4.0% m-o-m) in July and activity was about 55% higher than in 2019.
There continue to be some divergences between provincial markets. Compared to the average level of 2019, the number of transactions is well above its pre-pandemic level in Alberta (+56%), Saskatchewan (+45%), Newfoundland (+21%), BC (+11%), and PEI (+10%). On the flip side, activity is well below in Ontario (-20%), Quebec (-13%), Nova Scotia (-12%), and New Brunswick (-8%).
New listings rose 5.6% m-o-m seasonally-adjusted in July, a fourth consecutive month of increase. New listings increased in most provinces, with the biggest gains in Nova Scotia, Alberta, Ontario, and BC.
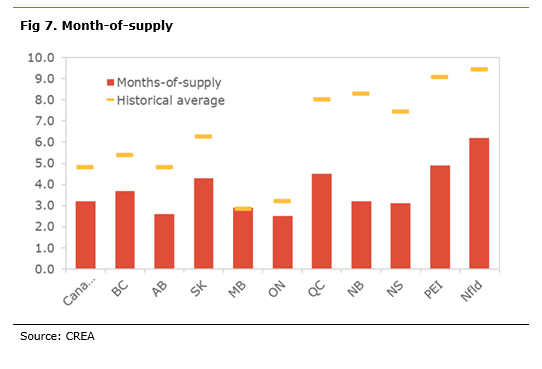
With sales activity being weaker than new listings in most regions, the month-of-supply measure[1] was edged higher to 3.2 nationally, but still almost 1.0 months lower than at the start of year, suggesting a tightening of the housing market. Based on this measure, BC, Ontario and Newfoundland saw the biggest increase in inventories, while it declined the most in Saskatchewan, Quebec and PEI.
Compared to the highest level of inventory reached during the recent housing market correction, the month-of-supply has decreased the most in BC (2.2 months), Saskatchewan (1.8 months), PEI (1.7 months), Alberta (1.2 months), and Newfoundland (1.2 months).
With a month-of-supply at 2.6, Alberta’s housing market is at its tightest since 2007, if we exclude the pandemic.
With continued robust sales and low inventories, the MLS House Price Index rose by 1.1% m-o-m. Compared to last year, house prices declined nationally by 1.8% y-o-y. Almost all areas saw higher prices in July. The biggest monthly increases were in Niagara (+2.1% m-o-m), Moncton (+1.9% m-o-m), Hamilton-Burlington (+1.8% m-o-m), Montreal (+1.7% m-o-m), BC Lower Mainland (+1.7% m-o-m), Vancouver Island (+1.7% m-o-m). Prices increased the least in Oakville-Milton (+0.2% m-o-m), Edmonton (+0.2% m-o-m), Okanagan (+0.4% m-o-m), and Saskatoon (+0.4% m-o-m).
On a y-o-y basis, most regions have seen lower prices, with the most significant declines in Niagara (-6.6% y-o-y), Edmonton (-6.5% y-o-y), Vancouver Island (-4.9% y-o-y), Barrie (-4.8% y-o-y), and Victoria (-4.8% y-o-y). Prices rose compared to last year in Calgary (+5.5% y-o-y), Oakville-Milton (+2.9% y-o-y), Toronto (+1.1% y-o-y), Moncton (+1.0% y-o-y), and Saskatoon (+0.3% y-o-y).
Compared to their recent peaks, prices have declined by 9.8% nationally. However, prices are still almost 40% higher than they were in January 2020 on the eve of the pandemic. Compared to their recent peak, prices dropped the most in Niagara (-15%), Barrie (-15%), Hamilton-Burlington (-16%), Guelph (-14%), Oakville-Milton (-13%), Toronto (-9%), Ottawa (-9%) and Vancouver Island (-9%). Prices have corrected the least in Moncton (-0.6%), Regina (-3.6%), Montreal (3.9%), and Winnipeg (-4.5%). Prices have not declined in Calgary and Saskatoon.
In Alberta, benchmark prices rose 1.0% m-o-m and are up 5.5% y-o-y in Calgary and by 0.2% m-o-m and -6.5 % y-o-y in Edmonton. There continues to be a divergence between the performance in Edmonton and Calgary, likely resulting from continued higher inventories in Edmonton.
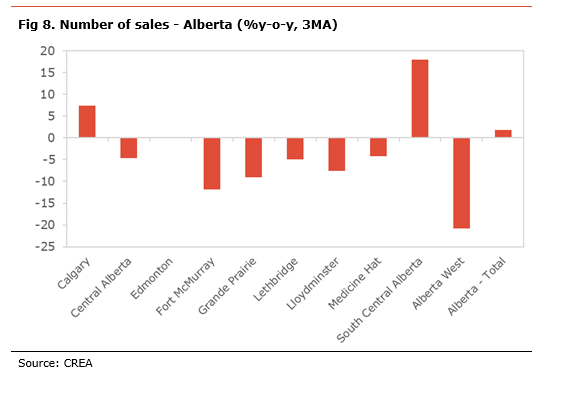
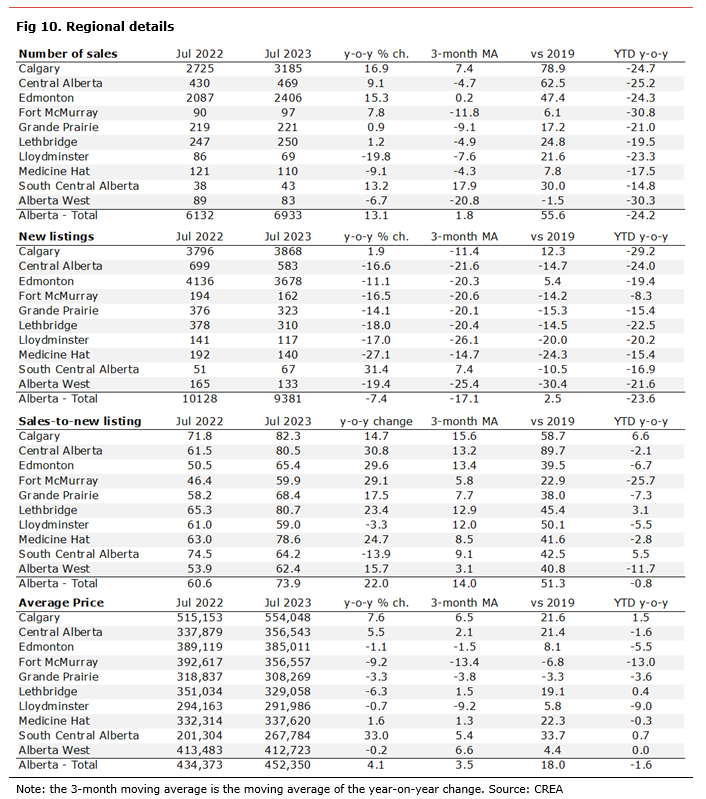
In Alberta, the housing market remains robust, with transactions still well above their pre-pandemic level. The number of transactions has increased in most regions compared to last year’s same month. (see table below for details). Compared to the average level of transactions in 2019, activity in the province increased by 56%, led by Calgary (+79%), Central Alberta (+63%), Edmonton (47%), South Central Alberta (+30%), Lethbridge (+25%), and Lloydminster (+22%).
New listings increased on the month at the provincial level and are lower than last year’s for the same month in every region except for South Central Alberta and Calgary. Compared to the average level of new listings in 2019, new supply in the province increased by 2.5% and was lower in all regions except in Calgary and Edmonton. New listings declined the most compared to 2019 in Alberta West (-30%), Medicine Hat (-24%), Lloydminster (-20%), Grande Prairie (-15%), Central Alberta (-15%), and Lethbridge (-15%).
With sales stronger than new listings in recent months, many regions have seen a tightening of their housing markets. The primary seller’s markets are Calgary, Lethbridge, Central Alberta, and Medicine Hat. The main buyer’s markets are Lloydminster, Fort McMurray, Alberta West, and South Central Alberta.
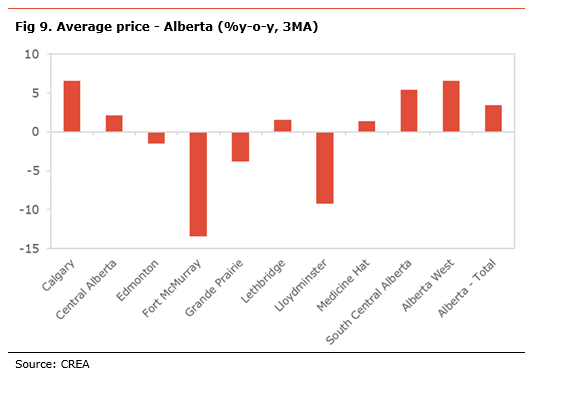
Average house prices have increased slightly (+3.5% y-o-y) on a 3-month moving average of the year-on-year in the province. Prices increased the most in Alberta West (+6.6%), Calgary (+6.5%), and South Central Alberta (+5.4%). However, prices declined on the same period in Fort McMurray (-13.4%), Lloydminster (-9.2%), Grande Prairie (-3.8%), and Edmonton (-1.5%).
[1] The month of supply measures how many months is would take at current sales volume and without an increase in listings to bring inventories to 0.
Independent Opinion
The views and opinions expressed in this publication are solely and independently those of the author and do not necessarily reflect the views and opinions of any organization or person in any way affiliated with the author including, without limitation, any current or past employers of the author. While reasonable effort was taken to ensure the information and analysis in this publication is accurate, it has been prepared solely for general informational purposes. There are no warranties or representations being provided with respect to the accuracy and completeness of the content in this publication. Nothing in this publication should be construed as providing professional advice on the matters discussed. The author does not assume any liability arising from any form of reliance on this publication.