Economic insights provided by Alberta Central Chief Economist Charles St-Arnaud.
Key takeaways:
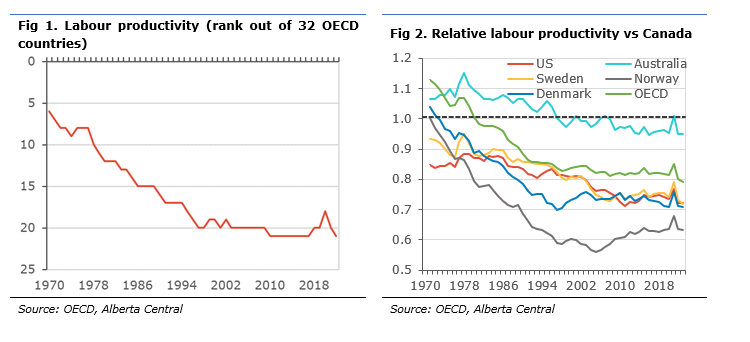
- Canada’s poor productivity performance has now been characterized as a national emergency. However, this mediocre performance is nothing new. Back in 1970, Canada had the sixth highest level of labour productivity out of thirty-two OECD countries; it now ranks twenty-second.
- Canadian labour productivity growth has persistently underperformed the US, Australia, and many other OECD countries over the past 55 years. As 2023, Canada’s level of labour productivity is 30% below the US, Sweden and Denmark, 40% below Norway, and 5% below Australia.
- Chronic underinvestment is likely the reason for weak productivity. While total private investment as a share of GDP has been above both the US and Australia since the 1970s, Canada’s non-residential investment has been persistently weaker than both countries over the period.
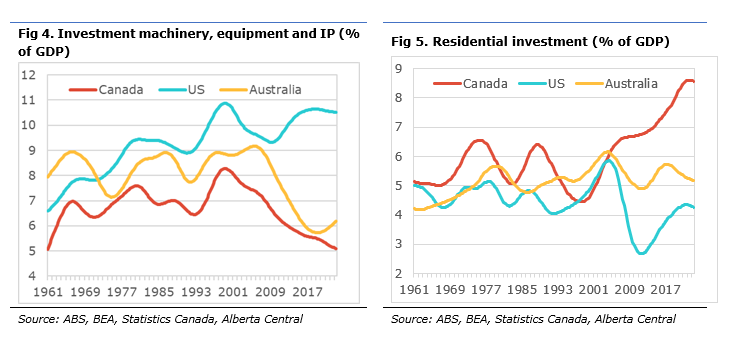
- More specifically, investment in machinery, equipment and intellectual property as a share of GDP has been consistently lower in Canada than in the US and Australia. Moreover, while this type of investment increased as a share of GDP in the US since the late 2000s, Canada’s measure declined to about half of that of the US (5% vs 10%).
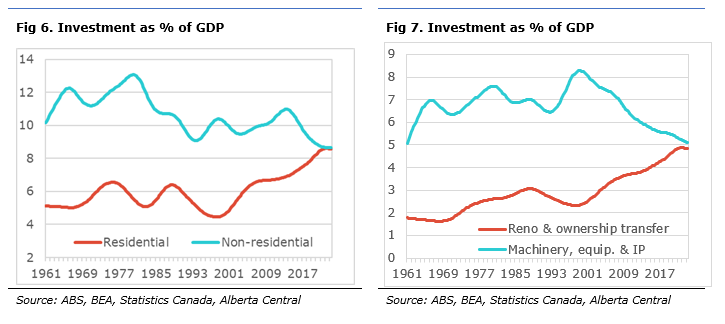
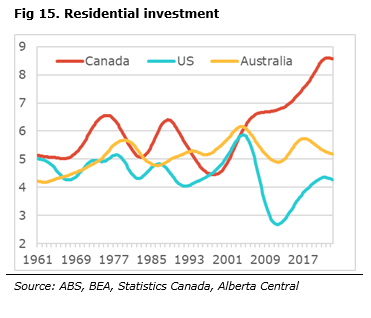
- On the flip side, residential investment has diverged from that of the US and Australia since the late 2000s, reaching 8.5% of GDP. This is more than double the comparative figure in the US and more than 3 percentage points higher than in Australia. Most of this increase in Canada is attributable to a rise in renovation and homeownership transfer costs (i.e. housing market churn).
- As a result, Canadians now spend as much per year as a share of GDP on renovations and homeownership transfer costs as they spend on machinery, equipment and intellectual property. In other words, we are investing more in less productive investments than improving the stock of capital.
- Why is Canada spending less on productive investment? Rather than looking at the demand side and asking why businesses are not investing, we take a different approach by looking at the supply of capital to finance investment. As most businesses need to borrow money to invest, a lack of available money or high financing costs will hamper the capacity of businesses to invest.
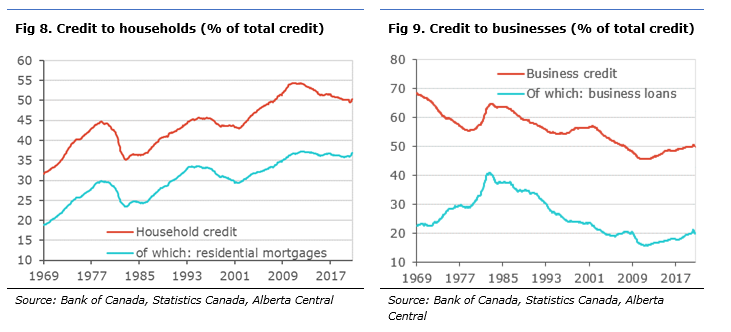
- Part of the reason for poor investment performance could be due to a lack of available funding. As such, a greater share of total credit in the economy is now being directed to household credit, mainly residential mortgages, while the share going to business credit has been declining.
- For one sector to invest, another sector must save to finance investment. In other words, the availability of funds in an economy is limited and scarce. Even if one sector wants to invest, if other sectors are unwilling or incapable of saving and lending funds, investment will suffer.
- Looking at the financial flow data, we find evidence that poor performance of non-residential investment could result from a “crowding out” of the corporate sector by other sectors swallowing all available lending.
- First, businesses were crowded out by big government deficits in the 1980s and 1990s, absorbing all net lending from households and non-residents. Then, from the early 2000s to now, significant net borrowing from households, at a rate of 3.5% of GDP per year, likely crowded out corporations.
- The competition for investible funds means that lending should go to the sector that can offer better returns to the lender, suggesting that the risk-adjusted return is insufficient to lend to corporations. This may be the result from two important factors: 1) a higher risk on corporate lending relative to lending to households, especially when considering the appreciating collateral for mortgage lending, and 2) higher capital requirements for corporate lending, leading to comparatively costlier loans.
- As we devise ways to improve productivity in Canada, it is crucial to not lose sight of how required investment will be financed and ensure that businesses have access to required capital. This will require 1) incentives to increase lending to corporations, such as reforming the current set of financial regulations to promote lending to businesses and reducing regulations that favour lending to households to the detriment of other sectors. 2) Incentives for households to save a greater share of their income to reduce their own borrowing and provide the funds required for business investment.
- There is a risk that, with housing affordability likely remaining an important issue for many years to come (see) and leading to continued significant mortgage borrowing, unless another sector provides net lending to the Canadian economy, the availability of funds available to corporations will continue to fall short, leading to lower investment and productivity.
- To solve productivity and support investment, measures will need to be put in place to ensure that businesses have access to the financing required to increase their level of investment. Otherwise, there will be continued chronic underperformance of Canada’s productivity.
Recent news has highlighted Canada’s poor productivity record, especially since labour productivity declined in Canada in recent quarters, diverging from the US. Additionally, GDP per capita in Canada also eased in recent quarters. Even the Bank of Canada weighed in, with Deputy Governor Carolyn Rogers sounding the alarm in a recent speech.
However, Canada’s poor productivity performance is not a recent phenomenon; instead, it has persisted for decades. Therefore, although this struggle with low productivity is worrisome, many of the factors leading to subdued gains in productivity have roots that date back decades.
In this report, we look at some of the underlying factors of this weak productivity performance. The weakness in business investment has often been cited as a culprit for Canada’s poor productivity, leading to weak growth in capital per worker. Consequently, most analysts focus on the demand for investment (i.e. why businesses want to invest), but there has been little focus on the supply side of investment (i.e. how these investments are financed). After all, if businesses do not have access to the needed capital, they will not invest.
Canada’s productivity performance
Canada’s productivity challenges are far from a recent phenomenon, reflecting a trend that has persisted for decades. In the early 1970s, Canada was positioned as a leader in labour productivity among its peers, ranking sixth highest in output per hour worked among 23 OECD countries. This commendable standing, however, began to wane significantly over time. Particularly from 1970 to 1996, Canada saw a steady decline in its productivity rank, eventually stabilizing to a position fluctuating between 18th and 20th place in the mid-1990s, a stark contrast to its earlier standing (Fig 1).
In analysis of Canada’s productivity performance, it is important not only to rely on its standing relative to the United States, despite its impressive performance. Instead, Canada’s performance must be evaluated against that of other small, open, industrialized nations. This broader comparison is crucial, as an economy’s structure greatly influences its productivity level. For example, Australia, with its heavy reliance on commodity exports and a strong trading relationship with China, shares notable economic resemblances with Canada and similar institutions, making it a natural comparison. Similarly, Sweden and Denmark are comparatively small economies that depend heavily on the European Union as their main trading partner. At the same time, Norway’s inclusion offers a perspective on an economy where oil and gas extraction plays a significant role. These countries provide diverse but relevant benchmarks to gauge Canada’s productivity performance.
In 1970, Canada’s labour productivity trailed the United States by about 15% and Sweden by 7%, yet it exceeded Australia by 6% and Denmark by 4%, and was on par with Norway (Fig 2). Fast forward to 2022, and the productivity landscape for Canada has shifted dramatically. The gap has widened substantially, with Canada now trailing Norway by nearly 40%, lagging almost 30% behind the United States, Denmark, and Sweden, and being a more modest 5% behind Australia. This decline illustrates a significant shift in Canada’s productivity relative to these nations over the past five decades.
Focusing on the productivity growth rate, which is key for potential economic growth, Canada has consistently underperformed compared to the United States, Australia, and the OECD average (23 countries). Since 1970, Canada’s annual productivity growth has been 0.34 percentage points (pp) lower compared to the United States, 0.20pp compared to Australia, 0.51pp compared to Sweden, 0.71pp compared to Denmark, 0.89pp compared to Norway and 0.74pp compared to the OECD average (Fig 3).
Looking at a more recent period, Canada’s underperformance has been lower compared to the following countries: 0.56pp versus the US, 0.12pp relative to Australia, 0.75pp compared to Sweden, 0.31pp compared to Denmark, and 0.54pp compared to the OECD average since 2015. However, Canada outperformed Norway marginally by 0.06pp.
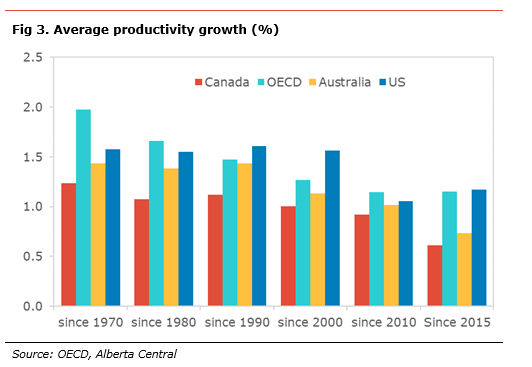
While recent underperformance looks small, it is significant as it compounds year after year. Another decade of underperformance similar to what we saw since 2015 means that Canadian productivity will be another 5.5% lower than the US, 1.2% relative to Australia, 7.3% relative to Sweden, 3.1% relative to Denmark, and 5.3% relative to OECD average, and would only improve marginally relative to Norway (+0.6%).
This persistent underperformance in productivity growth underscores the challenges Canada faces in enhancing its economic output and competitiveness on the global stage. This is especially crucial as productivity is an essential determinant of potential growth and GDP per capita growth.
Canada’s investment performance
A potential explanation for the perpetual underperformance in Canada’s productivity may be the country’s chronic lack of business investment.
To compare Canada’s investment as a share of GDP to the US and Australia over the past 55 years, we use trend data, after applying a Hodrick-Prescott filter, to focus on the structural shifts in investment and not get distracted by changes due to the economic cycle[1].
Examining the data reveals some very interesting trends (all charts in Appendix):
-
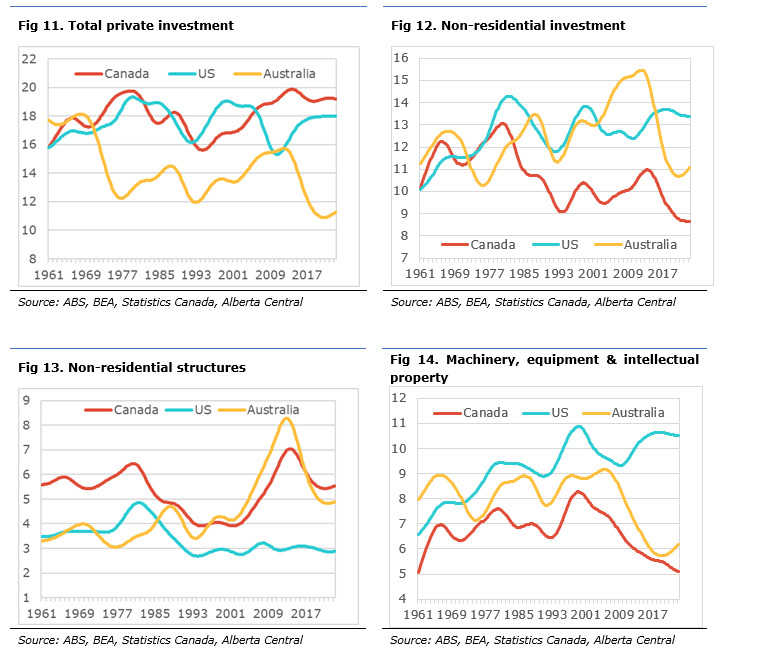
- The share of private investment in GDP (Fig 11), including residential and non-residential, in Canada and the US has hovered around 18% of GDP since the 1970s, above the same measure for Australia at 14%. Moreover, this share in Canada has been above both Australia and the US since the late 2000s by about 1pp of GDP relative to the US and 4pp relative to Australia.
- Focusing only on non-residential investment (Fig 12), composed of non-residential structures, machinery and equipment and intellectual property, we find that Canada’s share of investment in this sector, at around 10% of GDP, has underperformed both the US and Australia since the early 1980s, which hovered around 13% of GDP most of the period.
- After being similar to the US for most of the period, Australia’s non-residential investment outperformed the US between the mid-2000s and mid-2010s, reaching more than 15% of GDP compared to slightly above 12% in the US. It has underperformed since but is still outperforming Canada. The development of the Australian LNG export industry and the massive investment required likely explains this performance in non-residential investment over the past two decades.
- Drilling down further and focusing only on non-residential structures (Fig 13), Canada’s investment in the sector has outperformed chiefly both the US and Australia since the early 1960s. Between the early 1960s and early 1980s, Canada spent about 6% of GDP on non-residential structures, compared to less than 4% of GDP in both the US and Australia. The share of Canadian GDP going to this sector started to decline through the 1980s, reaching levels comparable to Australia, at 4% of GDP by the late 1980s. Both Australia and Canada saw a sharp increase in the 2000s and early 2010s, peaking at 8% and 7% of GDP, respectively, as Australia developed its LNG industry and Canada expanded the oil sands sector. The US underperformed both Commonwealth countries, investing only about 3% of GDP on average, since the early 1990s.
- Regarding remaining non-residential investment, we focus on the combined spending on machinery and equipment and intellectual property to consider the rise in the importance of computing, information technologies and the knowledge economy (Fig 4). The most apparent trend in this measure is that Canada’s share of GDP invested in the sector, at 7% of GDP on average since 1970, has consistently underperformed the US and Australia at 9% and 8% of GDP, respectively.
- Moreover, since the late 2000s, there has been a divergence in trends between the US, where the share of investment in machinery, equipment, and intellectual property has been trending higher, while it has been declining in Canada and Australia. As a result, Canada and Australia spend 5% and 6%, respectively, in the sector, while the US spends more than 10% of GDP.
- Looking at residential investment (Fig 5), Canada’s share of GDP spent in the sector before the mid-2000s has, on average, been above the US and Australia, but the difference is relatively small: 5.5% of GDP in Canada vs. 4.7% in the US and 5.0% in Australia. However, what is striking is the divergence in trend post mid-2000s: Canada has been on an upward trajectory and reaching more than 8% of GDP, Australia has been relatively stable at around 5.5%, and the US declined to about 4% of GDP currently.
What is evident from these observations is that Canada has been under-investing in non-residential investment, especially in machinery, equipment and intellectual property, for many decades. As a result, the accumulated stock of capital is likely lower than in the US and Australia over the period. (See Working Harder for Less by the CD Howe Institute for more information on the stock of capital). Due to this chronic underinvestment, this lower stock of capital is likely a source of the underperformance in productivity over the period.
Another important observation is how residential investment in Canada has outperformed and even diverged from the trend in the US and Australia over the past two decades.
Specifically, there is almost a perfect inverse relationship in Canada between the decline in the share of GDP going to investment in machinery, equipment and intellectual property and the increased share of GDP going into residential investment, especially renovation and ownership transfer costs, since the late-1990s. Over this period, the share of GDP dedicated to investment in machinery, equipment, and intellectual property has declined from 8.3% of GDP to 5% of GDP. At the same time, the share of GDP going to renovation and ownership transfer rose from 2.3% of GDP to almost 5% of GDP. In other words, Canadians spend as much per year on renovations and homeownership transfer costs as they spend on machinery, equipment and intellectual property (Fig 7).
Consequently, while business investment as a share of GDP changed little over the period, its composition has tilted towards much less productive investment; i.e., flipping houses rather than improving the stock of productive capital.
This analysis raises the question: Why has investment in machinery, equipment and intellectual property underperformed while residential investment, especially renovation and homeownership transfer costs, outperformed over the period?
Where does credit finance go?
An important question that needs to be addressed is: why have Canadian businesses been investing less in machinery, equipment and intellectual property than their peers, and why has it declined steadily since the late 1990s?
There are two different approaches to answering this question. The usual approach is to look at the demand side and ask why businesses are not investing. However, we take a different approach that we refer to as the “supply side” — more precisely, the supply of capital to finance investment. As most businesses need to borrow money to invest, a lack of available money or high financing costs will hamper the capacity of businesses to invest.
Examining the data on credit aggregates in the economy since 1969, we make the following observations:
-
- The share of credit to households has steadily increased since the early 1970s, from 32% of total credit to about 50% currently (Fig 8). Financial innovation and households’ greater access to credit, such as the advent of credit cards, etc., likely explain this trend. On the flip side, this means that the share of total credit going to businesses declined over the same period.
- From the late 1990s to the early 2010s, the share of households in total credit increased from 43% to 55%. Hence, more than half of the credit in the Canadian economy was directed towards the household sector by the second half of the 2000s.
- Digging deeper, we find that 17pp out of the 18pp increase in the share of total credit going to households since the early 1970s was from an increase in residential mortgages. The rest was an increase in consumer credit.
- On the flip side, the share of total credit going to businesses, which includes business loans, non-residential, bond and short-term paper issuance and equity issuance, declined steadily from 68% of total credit in the early 1970s to about 50% currently (Fig 9).
- Looking at some of the details, the share of business loans, which include non-residential mortgages and non-mortgage business loans, has declined from 40% of total credit in the early 1980s to 20% currently, reaching a low of 16% in the early 2010s.
- The share of credit from financial markets (short-term paper, bonds and equity issuances) was the main source of the decline in the share of business credit in total credit. In the early 1970s, it represented 44% of total credit and now it is about 30%.
These observations suggest that credit availability for businesses has diminished over the past few decades due to a more significant share being directed to households, especially toward residential mortgages. The result of a smaller share of credit to business coincides with the decline in business investment documented in the previous sector. Similarly, the rise in the share of credit to residential mortgages may explain the increase in residential investment.
However, the direction of the causation is not clear; is the share of credit to businesses declining due to less demand for borrowing by businesses to invest, or is less available credit to finance investment causing lower business investment?
Intuitively, there are a number of reasons that may support the lack of available credit as a possible reason for weak non-residential investment and the rise in credit availability to households:
- It is much less risky to lend to a household for a residential mortgage than to a business; this is because of the housing collateral that covers the loan in case of default. Moreover, over the past three decades, quasi-continuous rising house prices have meant that the value of this collateral increased throughout the loan, further reducing the risk associated with mortgage lending for lenders. On the flip side, the collateral for business borrowing often has a declining or less certain value.
- The capital requirements that financial institutions need to meet are less stringent and costly for residential mortgages than for business lending; this means that financial institutions must set aside a smaller amount of capital.
Hence, it is much less risky and costly for financial institutions to lend for residential mortgages than business loans. This could explain the reduction in credit availability to businesses, leading to a decline in spending on productive business investment.
For someone to invest, someone needs to save
Where does the money available from lending come from? After all, financial institutions are only intermediaries that collect savings and issue loans with that money.
In a closed economy, i.e. if there is no access to global capital markets, the amount of investment in the economy will equal the amount of savings. This implies that for someone in the economy to invest, someone else needs to save. Allowing for foreign capital, we have the following identity:
Current account = saving – investment
This identity stipulates that if investment in a country is higher than the amount of national savings, the difference must be borrowed from non-residents. Hence, there is a current account deficit. Conversely, if investment is below national savings, the extra money is lent to non-residents, leading to a current account surplus.
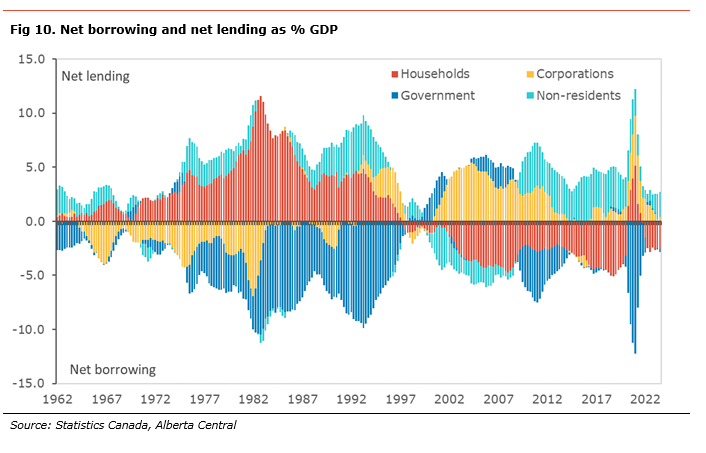
The financial flow data in the national account allows the decomposition of national savings and national investment by sectors of the domestic economy. As such, each sector, namely households, corporations, government and non-residents, can be either a net lender (investor) or a net borrower (saver) in the economy (Fig 10).
This distinction is crucial. For one sector to be able to borrow to invest, another sector needs to save to lend necessary funds for investment purposes. In other words, the availability of funds in an economy is limited and scarce. Even if a sector wants to invest, if other sectors are unwilling or incapable of saving and lending funds, investment will suffer.
Looking at the financial flow data from 1961 provides useful information on which sectors were the lenders and borrowers. We make the following points by sector:
- Households were net lenders of funds from 1961 to 1997. As such, they provided the equivalent of 3.5% of GDP per year in net lending, even reaching a peak of more than 10% in the early 1980s. Since 1997, this sector has been a net borrower, absorbing on average the equivalent of 2.5% of GDP per year, with periods as high as over 4.5% of GDP in the late 2010s.
- Corporations were net borrowers between 1961 and the early 1980s, absorbing the equivalent of 2.5% of GDP per year. During the 1980s, this sector was mostly neutral, except at the turn of the 1980s when it returned to borrow about 2% of GDP per year. Since then, this sector has been chiefly a net lender, providing 1% of GDP on average between 2002 and 2012.
- Whether the government sector is a net lender or a net borrower follows closely the history of government deficits in Canada. The government sector was a small net borrower until the late 1970s. Then, as governments started to make bigger and bigger fiscal deficits, the sector’s net borrowing started to balloon, absorbing more than 6% of GDP on average every year between 1978 and 1995. Since then, the government sector’s net borrowing has been much more modest, increasing during the financial crisis and the pandemic due to countercyclical fiscal policy, with periods of net lending in periods of fiscal surplus.
- Net residents have been mostly net lenders to the Canadian economy, except during the 2000s, when the current account surplus reached an average of approximately 1.7% between 2000 and 2008. Since the financial crisis, net residents have been the main source of net lending, providing the equivalent of more than 3% of GDP per year.
In analysis of the evolution of which sectors are net lenders or net borrowers and focusing on the corporate sector, specifically, there are some interesting explanations into the dynamics at play.
As there are limited resources in an economy, if a sector consumes all the available lending resources, either there is nothing left for other sectors to borrow or sectors must compete to access these resources by paying higher borrowing costs. After being a net borrower in the 1960s and the early 1970s, the corporate sector became neither a net borrower nor a net lender in the late 1970s as the government sector became a significant net borrower. This is very much in line with economic theory: big government deficits tend to crowd out private investment. As the government started to reduce its deficit, we saw that crowding out of private investment was reversed. However, instead of witnessing an increase in borrowing and investment by the corporate sector, or in other words, a return to a net borrowing position for this sector, the household sector became the significant net borrower, absorbing most of the net lending.
An explanation for the lack of borrowing by the corporate sector could be a greater reliance on internal sources of funds to finance investment. However, even in this scenario, this change of behaviour may have been due to a lack of available financing.
Households are absorbing a greater share of investible funds.
From the mid-1990s to today, we saw the household sector as the main borrower, absorbing most of the net lending available during that period. This also coincides with the period where household indebtedness rose sharply from about 100% of disposable income to about 180% currently, with mortgage debt contributing more than 60pp to this increase.
As we saw earlier, most of the borrowing by the household sector was directed towards financing higher residential investments, especially for renovation and ownership transfer costs. The impact on other sectors has been a crowding out of the corporate sectors. Moreover, as mentioned previously, this has led to most of the available lending being used to finance investments that could be qualified as “non-productive” or have a limited impact on productivity growth.
The fact that the government sector absorbed all the available lending resources from the late 1970s to the mid-1990s and that the household sector did the same since the mid-1990s may explain the chronic lack of available lending resources over the past four decades. As a result of this lack of available money for investment, business investment in machinery, equipment and intellectual property declined over the period.
Although it is not clear whether corporations were unwilling or unable to borrow, the evidence seems to point toward some “crowding out” due to persistent net borrowing by households.
The competition for investible funds means that lending should go to the sector that can offer better returns to the lender. This suggests that the risk-adjusted return was insufficient to lend to corporations. As mentioned in the previous section, the lower return on lending could be the result of two important factors: 1) higher risk on corporate lending relative to lending to households, especially when considering the appreciating collateral for mortgage lending, and 2) higher capital requirements for corporate lending, making these loans more costly than lending to households.
Any plan to improve productivity will require measures to finance investment
As we devise ways to improve productivity in Canada, it is crucial not to lose sight of how required investment will be financed and ensure that businesses have access to the required capital.
As we have shown, this will mean ensuring that corporations can return to being net borrowers. It will also mean that another sector – either the government, non-residents, or households – must provide the required lending or saving.
This involves the development of:
-
-
- Incentives to increase lending to corporations, such as reforming the current set of financial regulations to promote lending to businesses and reduce regulations that favour lending to households at the detriment of other sectors.
- Incentives for households to save a greater share of their income to reduce their own borrowing and provide the funds required for business investment.
-
Housing affordability will remain an important issue for the Canadian economy for many years (see What does it mean to restore housing affordability? Significant sacrifices and adjustments). This means that households will continue to require significant mortgage borrowing to own a property. As a result, the sector is likely to remain a large borrower for some time and has very limited capacity to become a net lender.
There is a risk that, unless another sector, especially non-residents, continues to provide net lending to the Canadian economy, the availability of funds available to corporations will continue to fall short, leading to lower investment and productivity.
Conclusion
Despite being recently declared a national emergency, Canada’s comparatively weaker productivity is not a new development; it is due to decades of underperformance compared to its peers.
The data suggests that weak business investment, especially in machinery, equipment and intellectual property, is a likely culprit for subpar productivity, while a more significant share of investment is being directed to much less productive use such as residential renovations and ownership transfer costs.
Therefore, it is important to consider that businesses need access to financing to invest. The evidence of the past four decades shows that the corporate sector has likely been crowded out, first by the government sector in the high deficit era of the 1980s and 1990s and then by households starting in the mid-1990s as this sector dramatically increased its debt levels, especially mortgage debt.
The economy has limited resources. If a sector consumes all the available lending resources, nothing is left for other sectors or they are forced to compete for those resources and pay higher borrowing costs.
To solve productivity and support investment, measures will need to be put in place to ensure that businesses have access to the financing required to increase their level of investment. Falling short will lead to continued chronic underperformance in Canada’s productivity.
Appendix: Investment as % of GDP
[1] The Hodrick–Prescott filter (also known as Hodrick–Prescott decomposition) is a mathematical tool used in macroeconomics, especially in real business cycle theory, to remove the cyclical component of a time series from raw data. It is used to obtain a smoothed-curve representation of a time series, one that is more sensitive to long-term than to short-term fluctuations.
Looking for more ? Subscribe now to receive Economic updates right to your inbox here!
Independent Opinion
The views and opinions expressed in this publication are solely and independently those of the author and do not necessarily reflect the views and opinions of any organization or person in any way affiliated with the author including, without limitation, any current or past employers of the author. While reasonable effort was taken to ensure the information and analysis in this publication is accurate, it has been prepared solely for general informational purposes. There are no warranties or representations being provided with respect to the accuracy and completeness of the content in this publication. Nothing in this publication should be construed as providing professional advice on the matters discussed. The author does not assume any liability arising from any form of reliance on this publication.