Key takeaways:
- As a result of more than a decade of house prices substantially outperforming income and higher interest rates in recent years to fight inflation, housing affordability is at its lowest in four decades in many Canadian cities.
- It has been well documented and discussed that housing shortages have been the main cause of rising house prices, especially in recent years, and boosting housing supply will be key to restoring affordability.
- However, little attention is paid to the necessary adjustment in house prices, incomes and interest rates that would be required to restore affordability.
- Based on our metrics using more than 40 years of data, affordability in Toronto and Vancouver has never been this low. For Montreal, Ottawa, and Winnipeg, we are a level not seen since 1981. At the other end, affordability in Calgary and Edmonton is slightly above historical averages, but eroding rapidly, especially in Calgary.
- Affordability has worsened rapidly since early 2022, when interest rates increased. Montreal saw the biggest decline in affordability over the period, followed by Vancouver, Ottawa, Winnipeg, and Calgary. Thanks to declining house prices, Toronto had the smallest deterioration.
- Unsurprisingly, the adjustments needed to restore affordability in cities such as Toronto, Vancouver, Montreal and Ottawa, are much bigger than in cities where affordability has remained higher (Calgary, Edmonton, and, to a lesser extent, Winnipeg).
- At current levels of income and interest rates, house prices would need to decline by 50% in Toronto, by 43% in Montreal, by 38% in Ottawa and 35% in Vancouver to restore affordability.
- At current house prices and interest rates, income in Toronto would need to more than double to restore affordability. Assuming a yearly increase in income of 4%, house prices would have to stagnate for almost 18 years. In Vancouver, incomes would need to rise by 83%, requiring a little more than 15 years of stagnant prices.
- At current house prices and income levels, interest rates would need to be negative in Toronto to restore affordability. Similarly, mortgage rates in Ottawa and Montreal would need to be below their lowest point in history.
- With monetary policy in restrictive territory and interest rates expected to be lowered later this year, we also look at what adjustments in house prices and incomes would be required if mortgage rates were to return to their average pre-pandemic level.
- The adjustments remain sizeable, with house prices needing to decline by 39% in Toronto, 33% in Vancouver, 30% in Montreal, and 23% in Ottawa, at current income levels. Interestingly, no decline in house prices would be needed in Calgary, Edmonton, and Winnipeg.
- Holding house prices constant, incomes would need to rise by 65% in Toronto, 50% in Vancouver, 43% in Montreal, 30% in Ottawa. Again, assuming income increases of 4% per year, restoring affordability requires almost 13 years of stable prices in Toronto, 10 years in Vancouver, 9 years in Montreal, and almost 7 years in Ottawa.
- What is clear from these results is that restoring affordability will come at a cost for current homeowners as they may see the value of one of their main assets stagnate for a long period of time or decline, with significant financial consequences for some.
- It is unclear whether current homeowners understand these costs and whether they are ready to bear these consequences. If they are not onboard, policies that are being put in place to restore affordability could backfire and lead to a homeowner revolt. This could derail the push to improve affordability and perpetuate the chasm between those who own versus those who do not.
- The significant house price underperformance necessary to restore affordability could prove to be a disincentive for homebuilders to increase the supply of new homes. This could mean that less housing units are effectively built than necessary to restore affordability, leading to affordability issues potentially taking much longer than anticipated to solve.
- There is a clear risk that without prompt actions, housing will become permanently unaffordable in Canada with significant costs on the rest of the economy.
Housing affordability is now a national crisis. House prices have increased at a pace well above income for over a decade. As we have shown previously (see here), historically low interest rates before the pandemic offset some of the impact of higher house prices and prevented a drastic decline in affordability. However, the rise in interest rates over the past two years to fight inflation, in addition to the pressures on prices due to record population growth, have pushed affordability to extreme lows in many Canadian cities. As such, we estimate that affordability in many cities is at its lowest since the early 1980s, when interest rates were around 20%. While there has been some reprieve in recent months thanks to declining house prices and lower market interest rates being passed on to longer term fixed mortgage rates, affordability remains at an extreme low in many Canadian cities, resulting in various economic costs.
It has been well documented that housing shortages have been the main cause of the deterioration in affordability in recent years and that increasing the supply of housing units will be key to restoring affordability. However, the impact on house prices necessary to bring housing costs to more normal levels is not discussed.
In this report, we update our valuation and affordability metrics for several Canadian cities. In addition, we provide simulations to determine how much of a decline in house prices, a decrease in interest rates and/or a rise in income would be required to restore affordability in these markets. These estimates are important because, while policymakers discuss restoring affordability at length, little attention or discussion is given to the size of adjustments required to achieve this goal.
Valuation metrics
We use the same valuation metrics as in our previous analysis: house price relative to income, house price relative to rent, mortgage payments relative to income, mortgage payments relative to rent and required income to afford the average home (see Appendix for detailed results). We focus our analysis on Canada’s major metropolitan areas – Vancouver, Calgary, Edmonton, Winnipeg, Toronto, Ottawa and Montreal – covering approximately 50% of the country’s population.

Due to the absence of clearly defined levels, determining whether an asset is overvalued or not is often subjective. Additionally, structural changes make equilibriums difficult to identify and time-varying. As a result, we focus on the difference between the current level of a metric and the “normal” level of this metric, or the level of various indicators since 1980. For this reason, we focus on the deviation of the various metrics relative to the historical mean of this measure for the region considered using a Z-score (see Appendix for background on Z-score).
As housing markets are local and depend on local conditions, the need to focus on city specific metrics is important. For example, conditions in Vancouver have meant that prices have generally been higher than elsewhere in the country for the past four decades. Despite these higher costs, an individual living in the city knows and understands this reality and will plan accordingly. A resident of Vancouver is unlikely to consider moving to Winnipeg or Edmonton, despite more affordable real estate, because of the high cost of commuting.[1]. One exception would be if a purchase in Winnipeg or Edmonton was for investment purposes, which would require investment-focused metrics not included in this analysis.
Key valuation findings:
- It shouldn’t come as a surprise that the Canadian housing market has become more overvalued in recent years, with an average Z-score of 3.3 across all valuation metrics. This is higher than the February 2022 score of 2.4 before the Bank of Canada started to hike interest rates and 1.0 in January 2020 on the eve of the pandemic. The current score is close to the highest level on record and higher than the 2.4 score reached in the early 1980s.
- As much as low interest rates helped to maintain affordability over the past decade, the normalization of interest rates since 2022 has been the main driver for the deterioration of affordability since, with a smaller contribution from higher prices.
- Many Canadian cities, including Vancouver, Toronto, Ottawa, and Montreal, have seen their average Z-scores reach record levels in recent months. With a Z-score of 4.1 in Toronto, 4.1 in Montreal, 3.4 in Ottawa and 2.9 in Vancouver, these markets have never been this overvalued. To add context, a Z-score of 4.3 suggests that, using a monthly occurrence, this statistical deviation would occur once every 10,000 months (or every 833 years).
- Other Canadian cities have also seen a sizeable deterioration in their valuation. Winnipeg has an average score only marginally lower than its record score of 2.2, while Calgary and Edmonton remain well below their respective peaks but above their long-term average of 1.9 and 0.7, respectively, compared to 0.1 and 0.1, respectively, before the start of the hiking cycle.
- Declining house prices in a number of cities are easing some of the overvaluation for select measures. As such, there has been a decline in price-to-income ratios. This easing in house prices has been more pronounced in markets that were identified as overvalued, such as Toronto, Ottawa and Vancouver. However, despite the decline in prices, these markets remain well into in overvalued territory with Z-scores above 3.
- Since early 2022, valuation metrics have deteriorated the most in Montreal and Calgary, by 1.5 and 1.3 points, respectively. In addition to the impact of higher interest rates, both cities have experienced a sizeable rise in house prices over the period.
- Despite interest rates remaining well below their long-term average, valuation metrics that include interest rates are generally above valuation metrics excluding interest rates, at 3.9 versus 3.3 nationally. This is the result of house prices being much higher than average, especially in relation to income.
- In general, most valuations have moved further into overvalued territory since February 2022; one exception is price-to-rent, as house prices declined while rent prices have continued to increase strongly in many markets. Even though we have seen big increases in rent across Canada in recent years, the level of overvaluation of house prices compared to the cost of renting remains elevated.

Affordability measures
Since house prices peaked nationally in early 2022, there has been a tug-of-war on affordability between higher interest rates and lower prices in some markets. However, higher interest rates have been much more powerful so far, reducing affordability significantly. We can see the combined impact of rising interest rates and lower house prices when looking at the required income measure[2], both in level and relative to average income, and the average mortgage payment relative to income.
Examining combined affordability measures, affordability has deteriorated in every city nationwide. The deterioration has been, unsurprisingly, more significant in areas where house prices were found to be overvalued. Specifically, we make the following observations:
- Affordability is the lowest in overvalued cities, which shouldn’t come as a surprise.
- Affordability in Toronto and Vancouver has never been this low, with Z-scores of 4.1 and 3.6, respectively. This is based on more than 40 years of data that includes the early 1980s when interest rates were around 20%. Montreal, Ottawa and Winnipeg are at their most unaffordable since 1981.
- For Calgary and Edmonton, affordability is only slightly above their long-term averages of 1.0 and 0.4, respectively. However, the rapid deterioration in affordability, especially in Calgary, suggests that policymakers need to remain vigilant to prevent these cities from following suit with other metropolitan areas.
- Affordability has declined meaningfully since the start of interest rate hikes. The biggest declines in affordability since February 2022 have been in Montreal (2.3 Z-score), followed by Vancouver (2.0 Z-score), Ottawa (1.5 Z-score), Winnipeg (1.4 Z-score), and Calgary (1.4 Z-score).
- Despite very high levels of house prices, Toronto experienced the smallest deterioration in affordability over the period (1.2 Z-score). This is the result of an approximately 15% decline in benchmark prices over the period, which offset some of the impact from higher interest rates.

Restoring affordability will require big sacrifices.
Rising interest rates and continued high prices have led to a significant deterioration in affordability in all major Canadian cities. While there have been price adjustments in a few markets since interest rates started to increase, this decline in prices has been too small to have an impact on affordability.
With affordability at or close to their lowest points in most Canadian cities, the question is: what would be required to restore affordability? This is an important question as policymakers, homeowners and the general public do not seem to grasp the required adjustment to reach this goal. However, this is not an easy question to answer, as it depends heavily on the level of affordability that one believes should be the equilibrium; i.e., what the equilibrium level for the mortgage-to-income ratio or the minimum required income to buy the average price should be.
There are three ways to restore affordability: 1) a fall in house prices, 2) a decline in interest rates, and/or 3) a rise in incomes. In this section, we estimate how much each of these factors would need to change to return affordability measures to presumably “normal” levels, keeping other factors constant to current levels.
The “normal” affordability measures considered are:
- The average level of affordability since 1980 based on a blend of mortgage-to-income and minimum family income required to buy a house relative to the average income in the region.
- A mortgage-to-income ratio of 25%. The idea behind this measure is that financial institutions will usually require total housing costs (mortgage, property taxes, insurance, condo fees and heating costs) to be below 30% of a person’s income to qualify for a mortgage. The CMHC has a similar measure to determine eligibility for mortgage insurance. A 25% mortgage payment to income allows 5% of income for additional housing-related expenses.
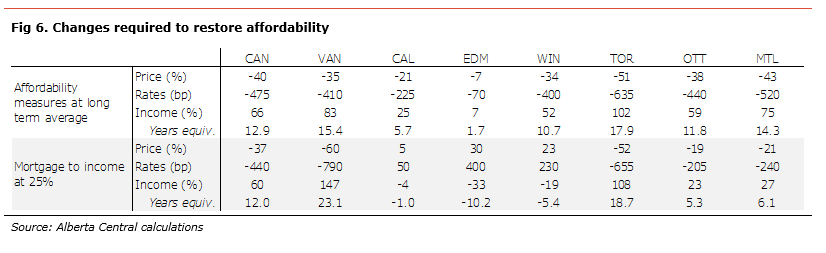
Unsurprisingly, the adjustments needed in the least affordable cities such as Toronto, Vancouver, Montreal, and Ottawa, are much bigger than in cities where affordability has remained higher (Calgary, Edmonton, and, to a lesser extent, Winnipeg). However, what is shocking is how big the adjustments – in terms of prices, interest rates and incomes – need to be in most markets to restore affordability (see Fig 6).
The change in prices required to restore affordability.
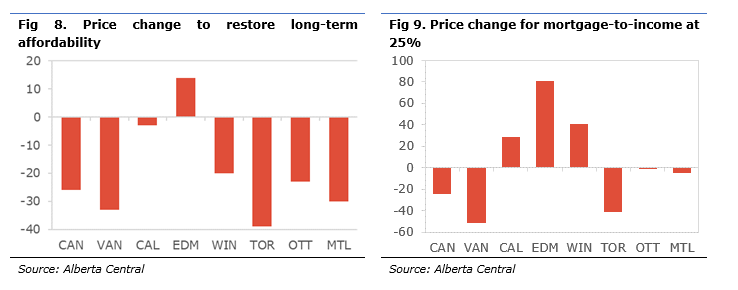
At the national level, house prices would need to decline by 40% to restore affordability to its long-term average, at current interest rates and income levels. Although most major cities in Canada require a significant decline in prices, there is an important dispersion between cities. At one end, house prices in Toronto would need to decline by 51%, 46% in Vancouver, 43% in Montreal, 38% in Ottawa and 34% in Winnipeg. On the other end of the spectrum, prices would only need to ease by a modest 7% in Edmonton and 20% in Calgary.
To bring mortgage-payments to 25% of average incomes, national house prices must decline by 37%. Here again, there are big differences between cities. For example, prices need to decrease by 60% in Vancouver and 52% in Toronto. On the other end, prices in Calgary, Edmonton, and Winnipeg can increase by 5%, 30% and 23% respectively.
Change in interest rates required to restore affordability.
Nationally, we estimate that interest rates would need to decline by 475bp to restore affordability to its long-term average. With the average mortgage rate on new mortgages at around 6.00% at the time of our estimates, this means that mortgage rates would need to be 1.25%, roughly 75bp below their lowest level reached during the pandemic, to restore affordability. In Toronto, interest rates would need to drop by 635bp. This means that Toronto requires a negative mortgage rate to be affordable. On the other end, interest rates would have to moderate by only 70bp to restore affordability in Edmonton and 225bp in Calgary.
If the aim is to have mortgage-payments at 25% of income, interest rates need to decline by 440bp nationally. In Vancouver, this would require a 790bp decline in interest rates and 655bp in Toronto; in both cases, mortgage payments being 25% of income would require negative interest rates. In Edmonton, interest rates would need to increase by 480bp to push the mortgage payment on the benchmark house to 25% of the average income. Interest rates would also have to increase in Calgary (+50bp) and Winnipeg (+230bp).
The change in income required to restore affordability.
To restore affordability to its long-term average, the average family income would need to rise by 66% nationally. To put this in perspective, it would take 10.4 years for the adjustment to happen if incomes increased by 4% each year, leaving house prices and interest rates constant. As a reference, between 2000 and 2019, disposable income per household increased by 3.1% on average, meaning that 4% growth could prove optimistic, especially in the current context where GDP per capita is declining in Canada. In Toronto, income would need to jump 102%, which would take 17.9 years, and by 83% in Vancouver (15. 4 years). In Edmonton, income would only need to increase by 7% (1.7 years) and by 25% (5.7 years) in Calgary.
For mortgage payments to be 25% of average income, average family income would need to rise by 60% nationally, or house price would need to stay constant for 9.6 years if income rises by 4% per year. In the case of Vancouver, this would mean a 147% increase in income, or 23.1 years, and 108% in Toronto (18.7 years). On the other end of the spectrum, income in Calgary would need to decrease by 4%, 33% in Edmonton and 19% in Winnipeg.
How much would a normalization in interest rates help?
The previous section provides estimates of how much house prices, mortgage rates and family income would need to change to restore affordability, leaving other factors constant. While very useful and interesting, these scenarios implicitly assume that these variables are somewhat at “normal” levels. Moreover, the scenario where interest rates are allowed to move freely assumes that interest rates could be used as a tool to restore affordability. However, the Bank of Canada’s mandate is price stability, as defined by its inflation-targeting framework, not housing affordability. In addition, as Gov. Macklem explained in a recent speech, “monetary policy cannot solve the underlying structural issues that are behind the lack of housing supply.”
Nevertheless, one could argue that with monetary policy currently in restrictive territory (see delayed recession), the current level of interest rates is higher than its equilibrium. Moreover, financial markets and analysts expect the Bank of Canada to cut its policy rate over the next two years.
The question is what is the equilibrium rate or neutral rate? The BoC defines the neutral rate as “the policy rate consistent with output at its potential level and inflation equal to the target after the effects of all cyclical shocks have dissipated the level of interest rate”. This means that when the policy rate is below the neutral rate, monetary policy is accommodative, and when above, it is restrictive.
The BoC estimates the neutral policy rate to be between 2% and 3%. However, as we noted before (see), we would argue that the strong population growth and potentially higher neutral rate globally could suggest a higher neutral rate in Canada; in our view, it is likely between 3% and 3.5%. However, what matters for the housing market is not necessarily the neutral policy rate; rather, it’s the associated mortgage rate, for which we lack a proper estimate.
For simplicity, we assume the equilibrium mortgage rate is the average mortgage rate that prevailed between 2010 and 2019, about 4%. This implies that the current rate is approximately 200bp higher than the average rate during this period. This is also roughly the same policy rate decline required to return the policy rate to the BoC’s estimate of neutral. However, it is important to note that this level could be an underestimation. As mentioned previously, the neutral rate may be higher now than before the pandemic. Nevertheless, it still provides very interesting observations on what is needed to restore affordability.
Assuming that mortgage rates should be 200bp lower, we calculate the “affordability frontier” or the various combinations of house prices and income changes that would be required to restore affordability, as defined previously. (Appendix contains charts illustrating the “affordability frontiers” for each city.)
As expected, by reducing the level of interest rates, the required changes in house prices and income are smaller than in the previous section. The difference between the two scenarios confirms the significant impact of interest rates on affordability, especially in overvalued markets with very high house prices.

Change in prices required to restore affordability.
Taking into account this lower rate, to return affordability to its long-term average, house prices would need to decline by 26% nationally, 39% in Toronto, 33% in Vancouver, 30% in Montreal, 23% in Ottawa and 20% in Winnipeg. In Calgary, only a modest decrease of 3% would be required, while prices in Edmonton have room to increase by 14% before reaching the long-term average.
If the aim is for mortgage payments relative to income to be 25%, prices need to decline 24% nationally, 50% in Vancouver and 41% in Toronto. Barely any changes in house prices would be required in Montreal (-4%) and Ottawa (-1%). In Calgary, Edmonton and Winnipeg, house prices could rise another 28%, 83% and 50%, respectively, before average mortgage payments reach 25% of income.
Change in income required to restore affordability.
By incorporating this lower rate, income would need to rise by 36% nationally to restore affordability; assuming incomes increase by 4% per year, this would take 7.8 years. The required increase is 65% in Toronto (12.8 years), 50% in Vancouver (10.3 years), 43% in Montreal (9.1 years), 30% in Ottawa (6.7 years), and 24% in Winnipeg (5.5 years). On the other end, Edmonton does not require a higher income, as even a decline of less than 13% in income would keep affordability higher than average. In Calgary, a modest increase of 3% in income would be needed.
To bring the measure of mortgage payment to income to 25%, income in Vancouver would need to increase 102% (17.9 years). In Toronto, a rise of 70% would be required (13.5 years), while in Montreal and Ottawa, only marginal increases of 4% and 1%, respectively, would be needed. In the case of Calgary, Edmonton and Winnipeg, no increase in income would be required, as the mortgage payment to income ratio would be below 25% at the current level of income.

Do homeowners understand the cost of affordability and are they willing to bear it?
The previous analysis indicates that sizeable adjustments would be required to restore affordability in most Canadian cities. This means that, at best, house prices will need to stagnate at their current level for many years for income to catch up to current prices. At worst, house prices need to decline meaningfully and rapidly. The most likely outcome is somewhere in the middle; the “affordability frontier” charts in the Appendix illustrate a blend of various scenarios (to view the appendix, newsletter sign-up is required).
Nevertheless, what is clear from all the possible combinations of declining house prices and rising income is that restoring affordability will come at a cost for current homeowners as they see the value of one of their main assets stagnate or decline, with significant financial consequences for some. More specifically:
- Many households have stretched themselves financially to buy a house. For many of these households, their home is their only financial asset, with little else in terms of savings or retirement funds. Any underperformance in house prices could have a significant financial impact on these households.
- If the adjustment is mainly through lower prices, there may be homeowners at risk of experiencing negative equity; this occurs when the value of a home is lower than the value of a mortgage. This would be particularly true for those who purchased since the pandemic.
- Homeowners who bought before the pandemic could also see some big changes in their net worth if prices decline substantially. This could potentially have some implication for households who borrowed against the equity of their homes.
An essential question is whether homeowners understand that solving affordability will come at a cost to them. Are they onboard with a prolonged period of underperformance or even sizeable declines in house prices? Interestingly, a survey last Fall by Nanos[3] showed that about 70% of Canadians would be happy to see a decline in house prices, with a lower share in Ontario at 60%. However, the survey does not distinguish between the answers from homeowners and those who do not own their homes. Moreover, the survey does not quantify the “decline” when asking the question. Does it refer to a small adjustment of less than 10% or the kind of decline required to restore affordability, as estimated previously?
As noble and essential as the cause to restore affordability is, if current homeowners are not ready for its associated costs, policies that are being put in place could backfire and lead to a homeowner revolt. This could derail the push to improve affordability and perpetuate the chasm between those who own versus those who do not. After all, as bedroom communities and suburbs surrounding major metropolitan areas carry a lot of political weight, voters in these regions are constantly courted by politicians seeking office.
Furthermore, the significant house price underperformance necessary to restore affordability could prove to be a disincentive to homebuilders in increasing the supply of new homes. This could mean that less housing units are effectively built than necessary to restore affordability, leading to affordability issues potentially taking much longer than anticipated to solve.
Conclusion
What these estimates show is that restoring affordability will not be a painless policy; instead, it will come at a cost, especially for current homeowners. However, choosing to do nothing shouldn’t be an option either. This is because a lack of housing affordability imposes significant costs on the rest of the economy, including:
- households needing to spend a greater share of their income on shelter, thereby reducing spending in other parts of the economy;
- increasing indebtedness levels as households overstretched themselves to reach homeownership, thereby making them more vulnerable to shocks;
- reduced flexibility in the labour market as workers think twice before accepting employment in more expensive cities;
- increased inequalities between homeowners and renters;
- immigrants and Canadians leaving the country due to the lack of affordability and homeownership opportunities, and;
- social issues such as homelessness, intergenerational poverty, etc.
Our analysis outlines two paths to solving affordability: a fast correction via a drop in house prices or a prolonged adjustment, taking over a decade, that will perpetuate the costs of low affordability for years. Policymakers will likely prefer the slow adjustment to reduce the cost on current homeowners as much as possible. However, it is not clear whether a faster adjustment would offer benefits to the broader economy, especially since it will mean continued low affordability for many years to come; this determination would require a thorough cost-benefit analysis.
One thing for sure is that there is a clear risk that without prompt actions, housing will become permanently unaffordable in Canada.
Footnotes:
[1] Although the increased prevalence of remote-working arrangements in the post-pandemic era could make such a situation feasible, this trend is too recent and not yet broadly used to influence the current analysis.
[2] An estimate of required family income to keep mortgage payments below 25% of income, at current interest rates. The idea behind this measure is that banks will usually require total housing costs (mortgage, property taxes, insurance, condo fees and heating costs) to be below 30% of income to qualify for a mortgage.
[3] https://nanos.co/wp-content/uploads/2023/09/2023-2452-Bloomberg-August-Populated-report-with-tabulations.pdf
Independent Opinion
The views and opinions expressed in this publication are solely and independently those of the author and do not necessarily reflect the views and opinions of any organization or person in any way affiliated with the author including, without limitation, any current or past employers of the author. While reasonable effort was taken to ensure the information and analysis in this publication is accurate, it has been prepared solely for general informational purposes. There are no warranties or representations being provided with respect to the accuracy and completeness of the content in this publication. Nothing in this publication should be construed as providing professional advice on the matters discussed. The author does not assume any liability arising from any form of reliance on this publication.